Multiplex Assay Software
Detailed, Informative Analysis Provides More Insight to Analyze, Optimize, Manage Your Multiplex AssaysSee your data in STATLIA MATRIX.
STATLIA MATRIX MP Expands Analysis, Optimization, Data Management Options for Your Multiplex Assays
Complete multiplex projects faster with more accurate results and detailed metrics to make reliable determinations and optimizations of analytes in a multiplex assay in less time. STATLIA MATRIX computes immunoassay, parallelism, and Pos/Neg screening multiplex assays.
- Easy, intuitive interface to run, analyze, manage, and optimize multiplex assays
- Select a multiplex raw data file and the data is processed and sent to a LIM system automatically
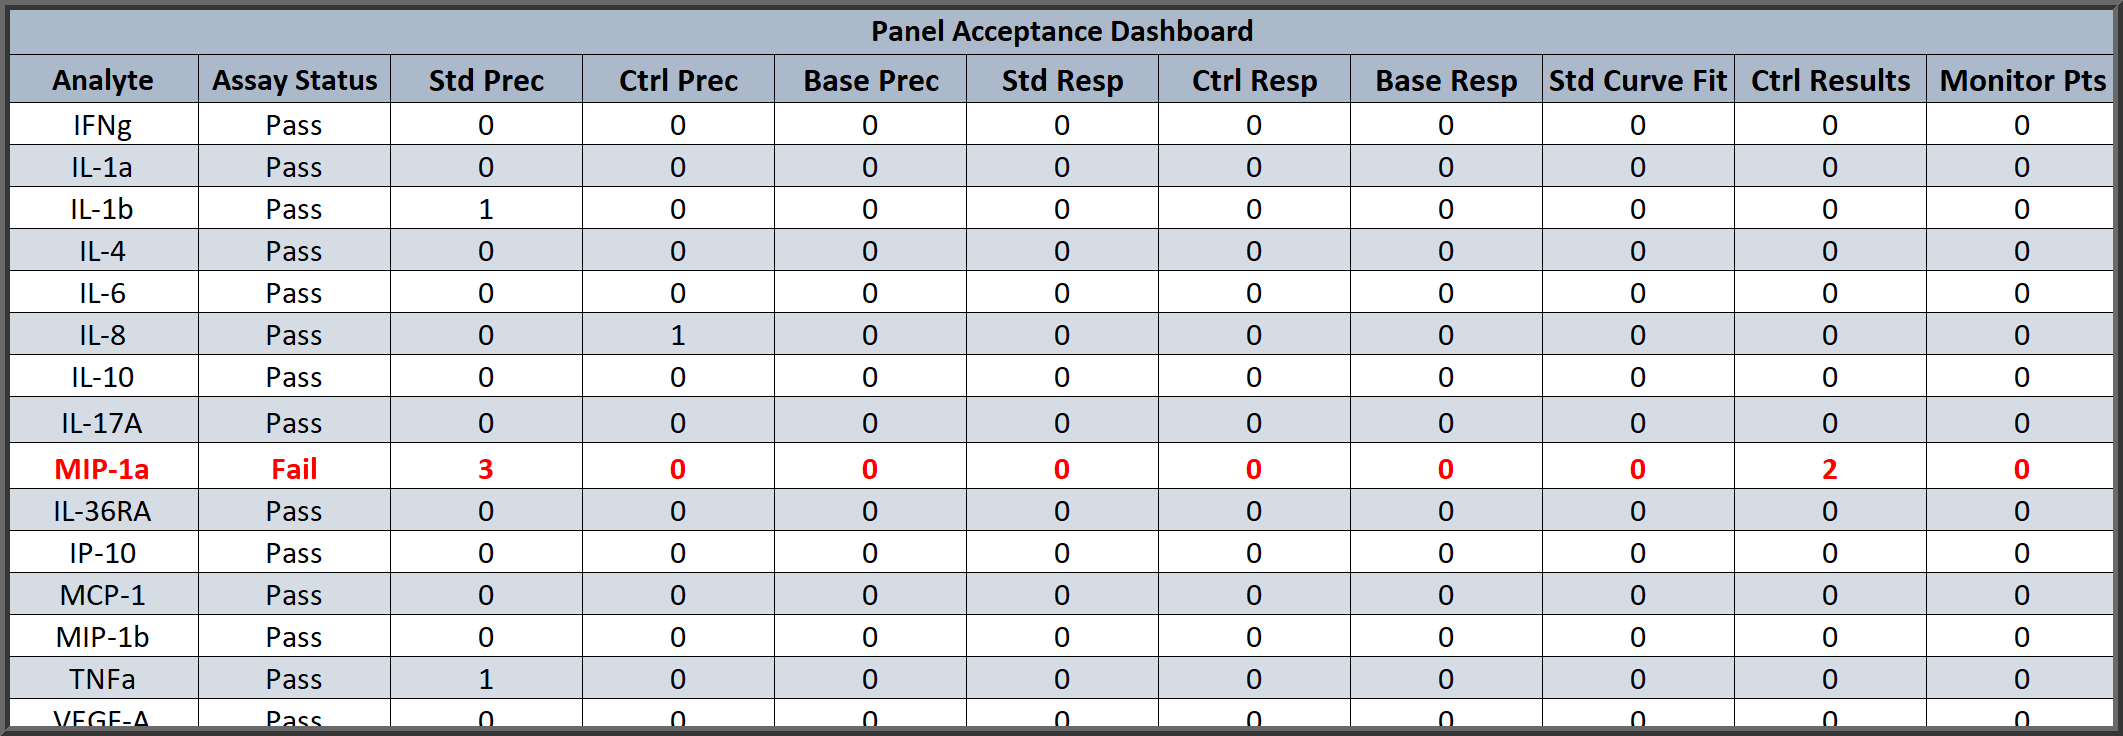
- QC Pass/Fail dashboard summary for each analyte with QC metrics based on your SOP criteria
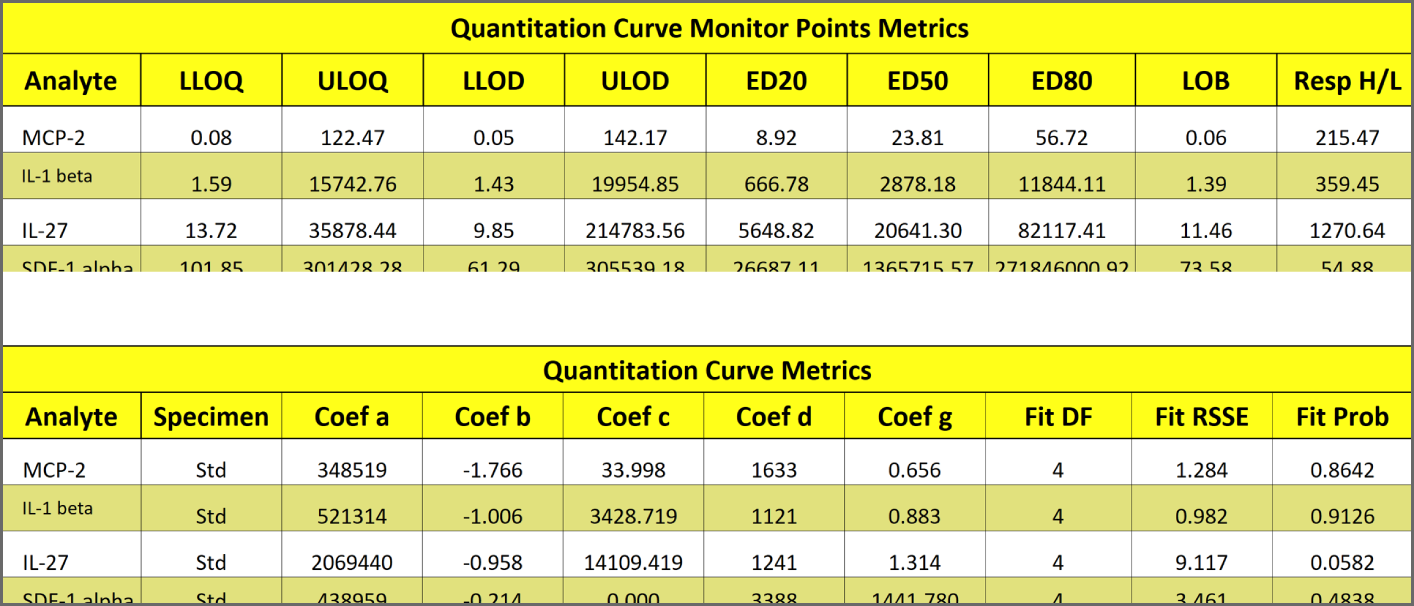
- Precise Limits of Quantitation (LOQs) and Limits of Detection (LODs) computed determinations for each analyte every run
- Gold standard weighted 5PL, 4PL curve fitting improves accuracy, reliability
- Auto outlier masking of flagged precisions, residuals, and nonmonotonic hooks
- Parallelism and calibrator shift determinations for reagent lot-to-lot comparisons
- Import worklist with unknown identifications and export results to LIM System
- Auto suppress failed results before sending to LIM
- Auto compute QC ranges, limits, weighting, and more from pooled previous panel runs
- Calibrator, weighting, and curve fitting optimization tools enhance each analyte’s performance
- All 21 CFR Part 11 and CLIA regulatory compliance requirements
Dashboard Summary of Each Analyte with Pass/Fail and QC Metrics for Quick, Detailed Analysis of Panel Run
Each multiplex run can include the summary table above for a quick review of the Pass/Fail determinations for each analyte and its unknowns based on your criteria. The table also includes a summary of the different QC metrics you entered which can be the same or different for each analyte, such as Standard Precision (%CV), Standard %Bias (backfit recovery), Goodness of Curve Fit, Control Results, and more. Any flagged metrics are listed at the bottom of the summary report.
With the custom report editor and the QC Acceptance function, you can modify the summary report and Panel Acceptance Summary table to match your laboratory’s Pass/Fail criteria and the QC metrics that you follow. The report editor also allows you to customize the entire summary report as well as the optional individual reports for each analyte in the multiplex.
Precise LOQ, LOD and Other Monitor Point Determinations Computed for Each Analyte Every Run
Precise upper and lower Limits of Quantitation (LOQs) and Limits of Detection (LODs) are automatically computed for each analyte in each multiplex run.
The LOQs determine the reportable range of reliable results. The LODs determine the range that the instrument can detect a reliable signal for each analyte. The LOQs and LODs are mathematically computed for each analyte from their standard curve data, without relying on empirical data. See the Tech Note: LOQs, LODs, Precision Error Profile, and Reportable Range and manuscript Determining the Error of Dose Estimates and Minimum and Maximum Acceptable Concentrations from Assays with Nonlinear Dose-Response Curves.
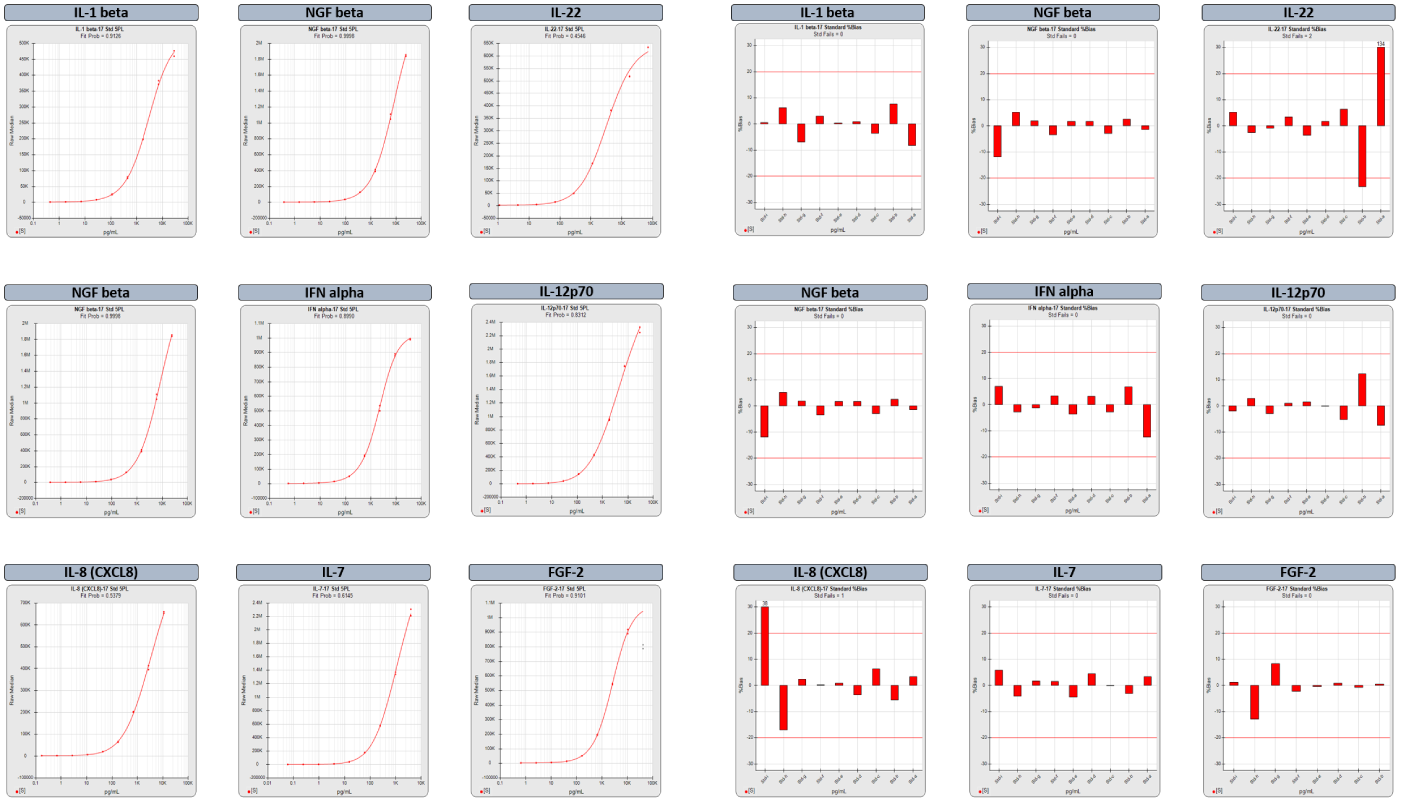
Powerful Graphs Offer Quick Insight into Performance and Reliability of Each Analyte in a Multiplex Run
For the summary report of a multiplex run, select from among multiple graphs that provide a quick overview of the performance of each analyte in a plex and its reliability for accurate results.
The two graph options above include the standard curves and the backfit recovery %Bias (red bars) of each standard dilution. The %Bias is the difference between the computed and expected concentrations of each standard point. The %Bias graphs show at a glance which regions of the curve have acceptable bias. The graphs for the FGF-2 analyte were computed after the software automatically masked the highest dilution to remove the hook. The masked responses are grayed out on the standard curve graph.
With the custom report editor, you can create different summary and analyte reports for different purposes. STATLIA MATRIX includes the following graph options for each analyte in a multiplex summary report and for the individual assay report of each analyte:
- Standard Curves
- %Bias Backfit Recovery
- Control Trending (LJ) Charts
- Control Results (Dose and Response)
- Standard Responses Confidence Limits
- LOQs and %Error of Each Unknown
- Squared Residual Error of Each Standard Dilution
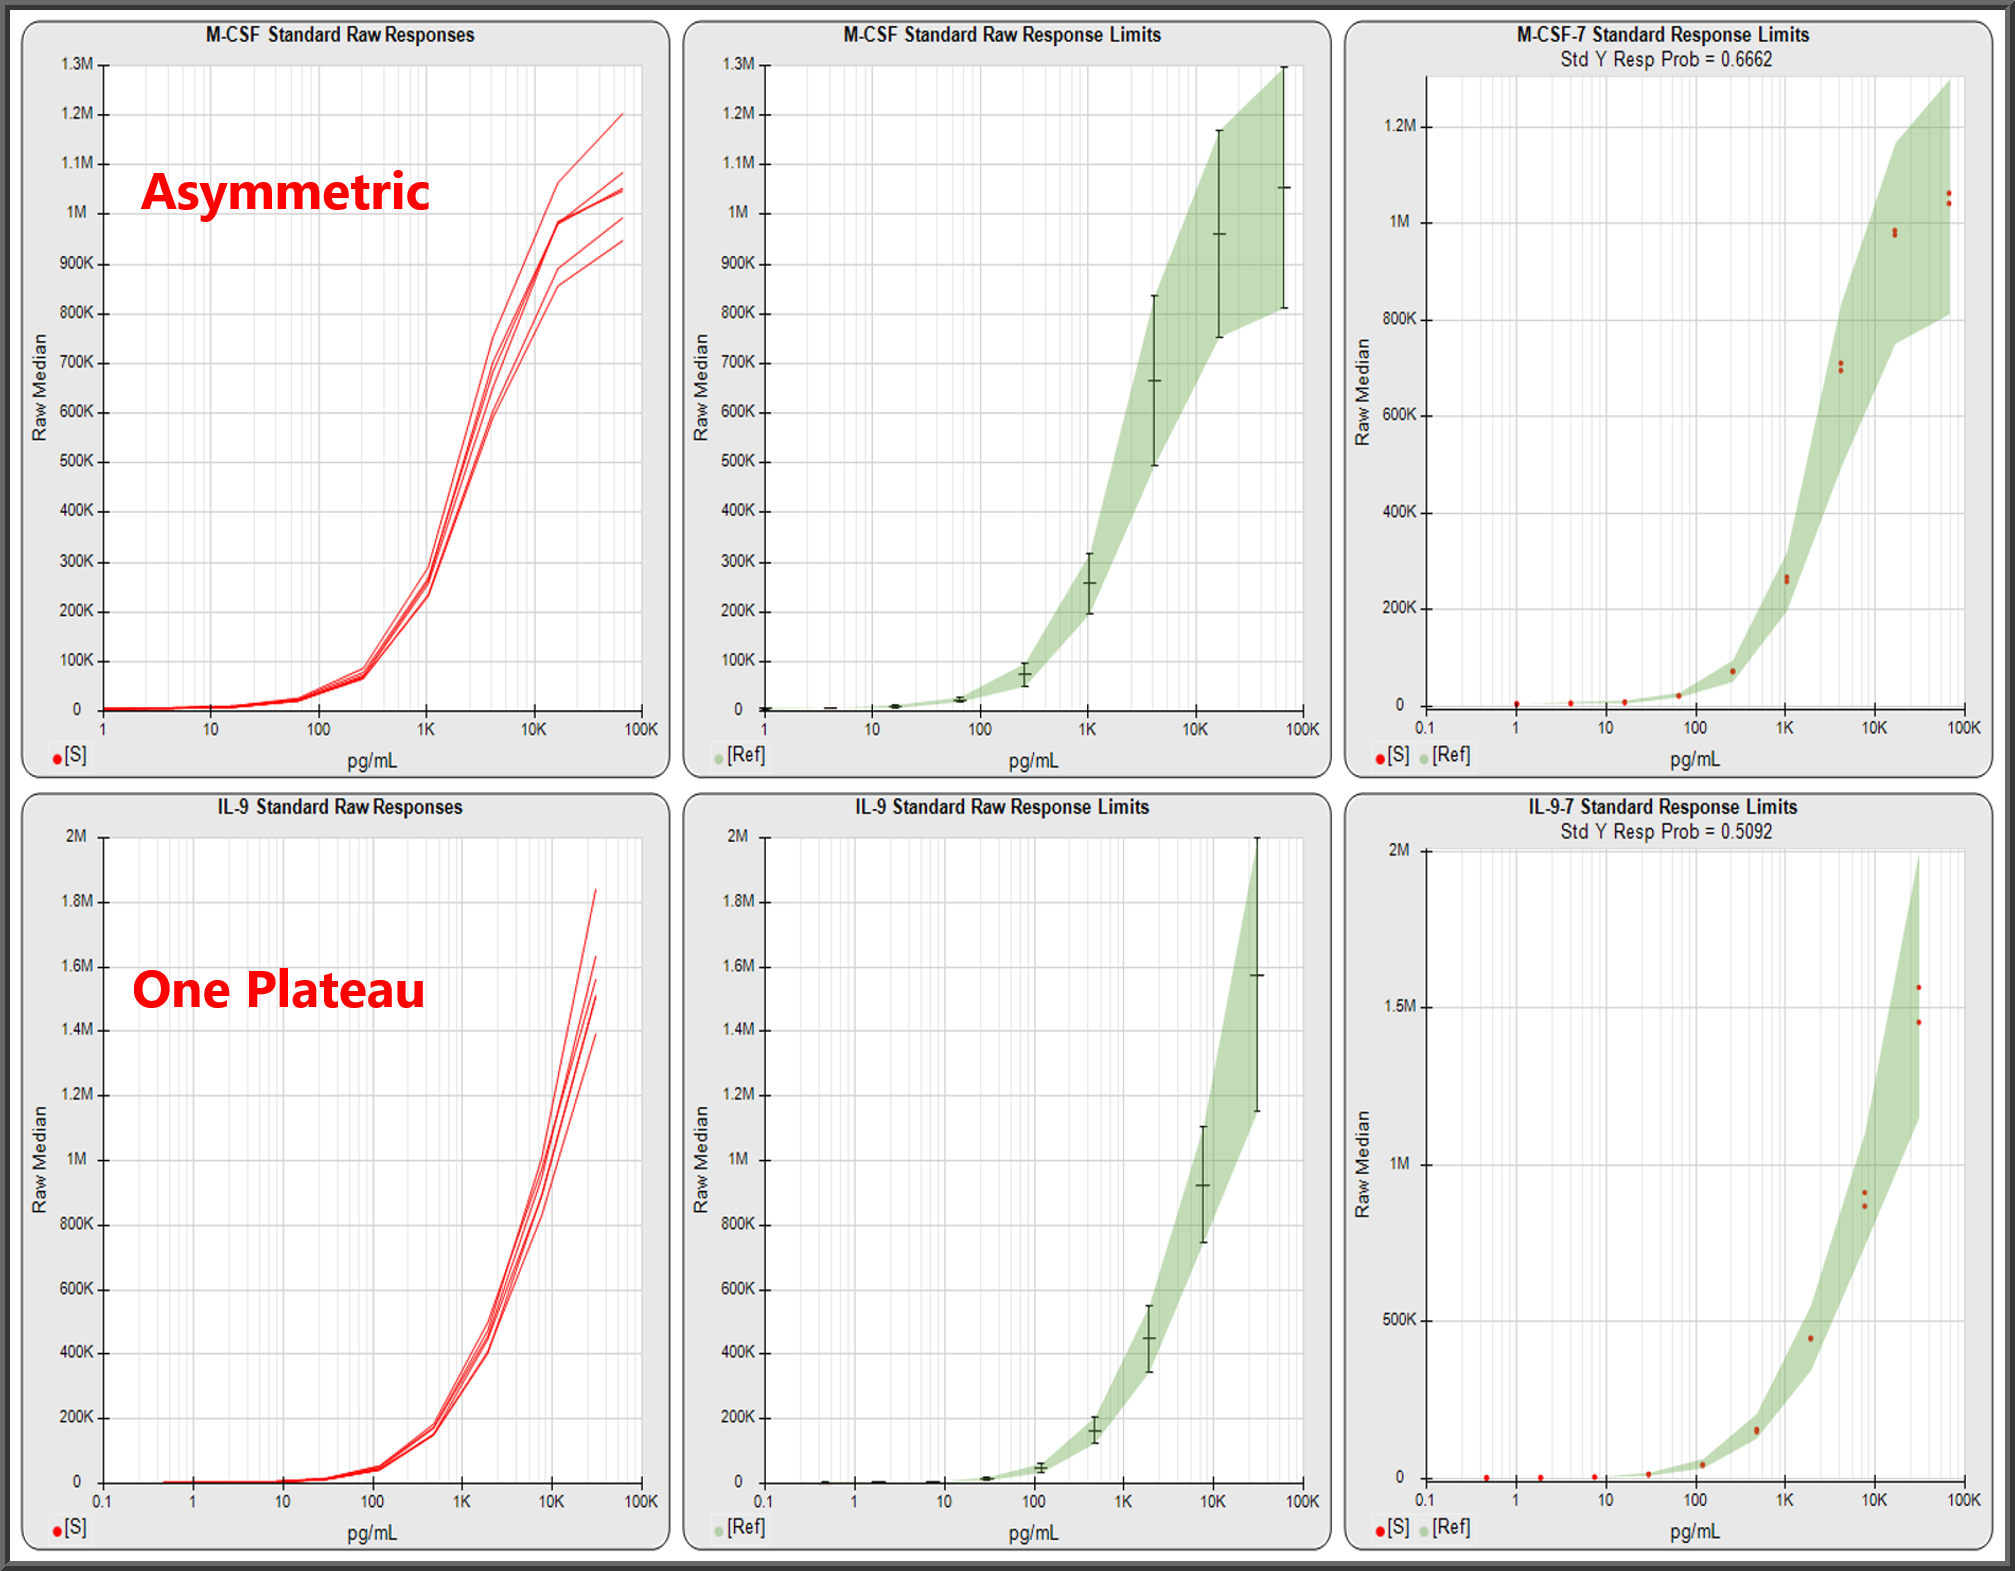
Pooled Panel Runs Provide Detailed Analysis to Optimize, Validate and Monitor Multiplex Assays
To assist with the analysis, STATLIA MATRIX can show you pooled data from multiple runs of each analyte’s data, such as the standard curve responses in the first graph. Pooled runs allow you to observe behavior in each analyte with 6 or more runs, which will provide a clearer picture than a single run.
Pooled runs, also enable the software to compute control ranges, limits, accurate pooled weighting estimates, and other statistical metrics.
The software also computes the confidence limits of each standard dilution’s expected responses, as shown in the middle graph. This makes it easy to determine if the standard responses for each analyte in today’s plex (red dots in third graph) were within their expected limits (green region).
Insightful Analysis, Parallelism, Automated Masking and More Offer Useful Tools to Optimize Analytes
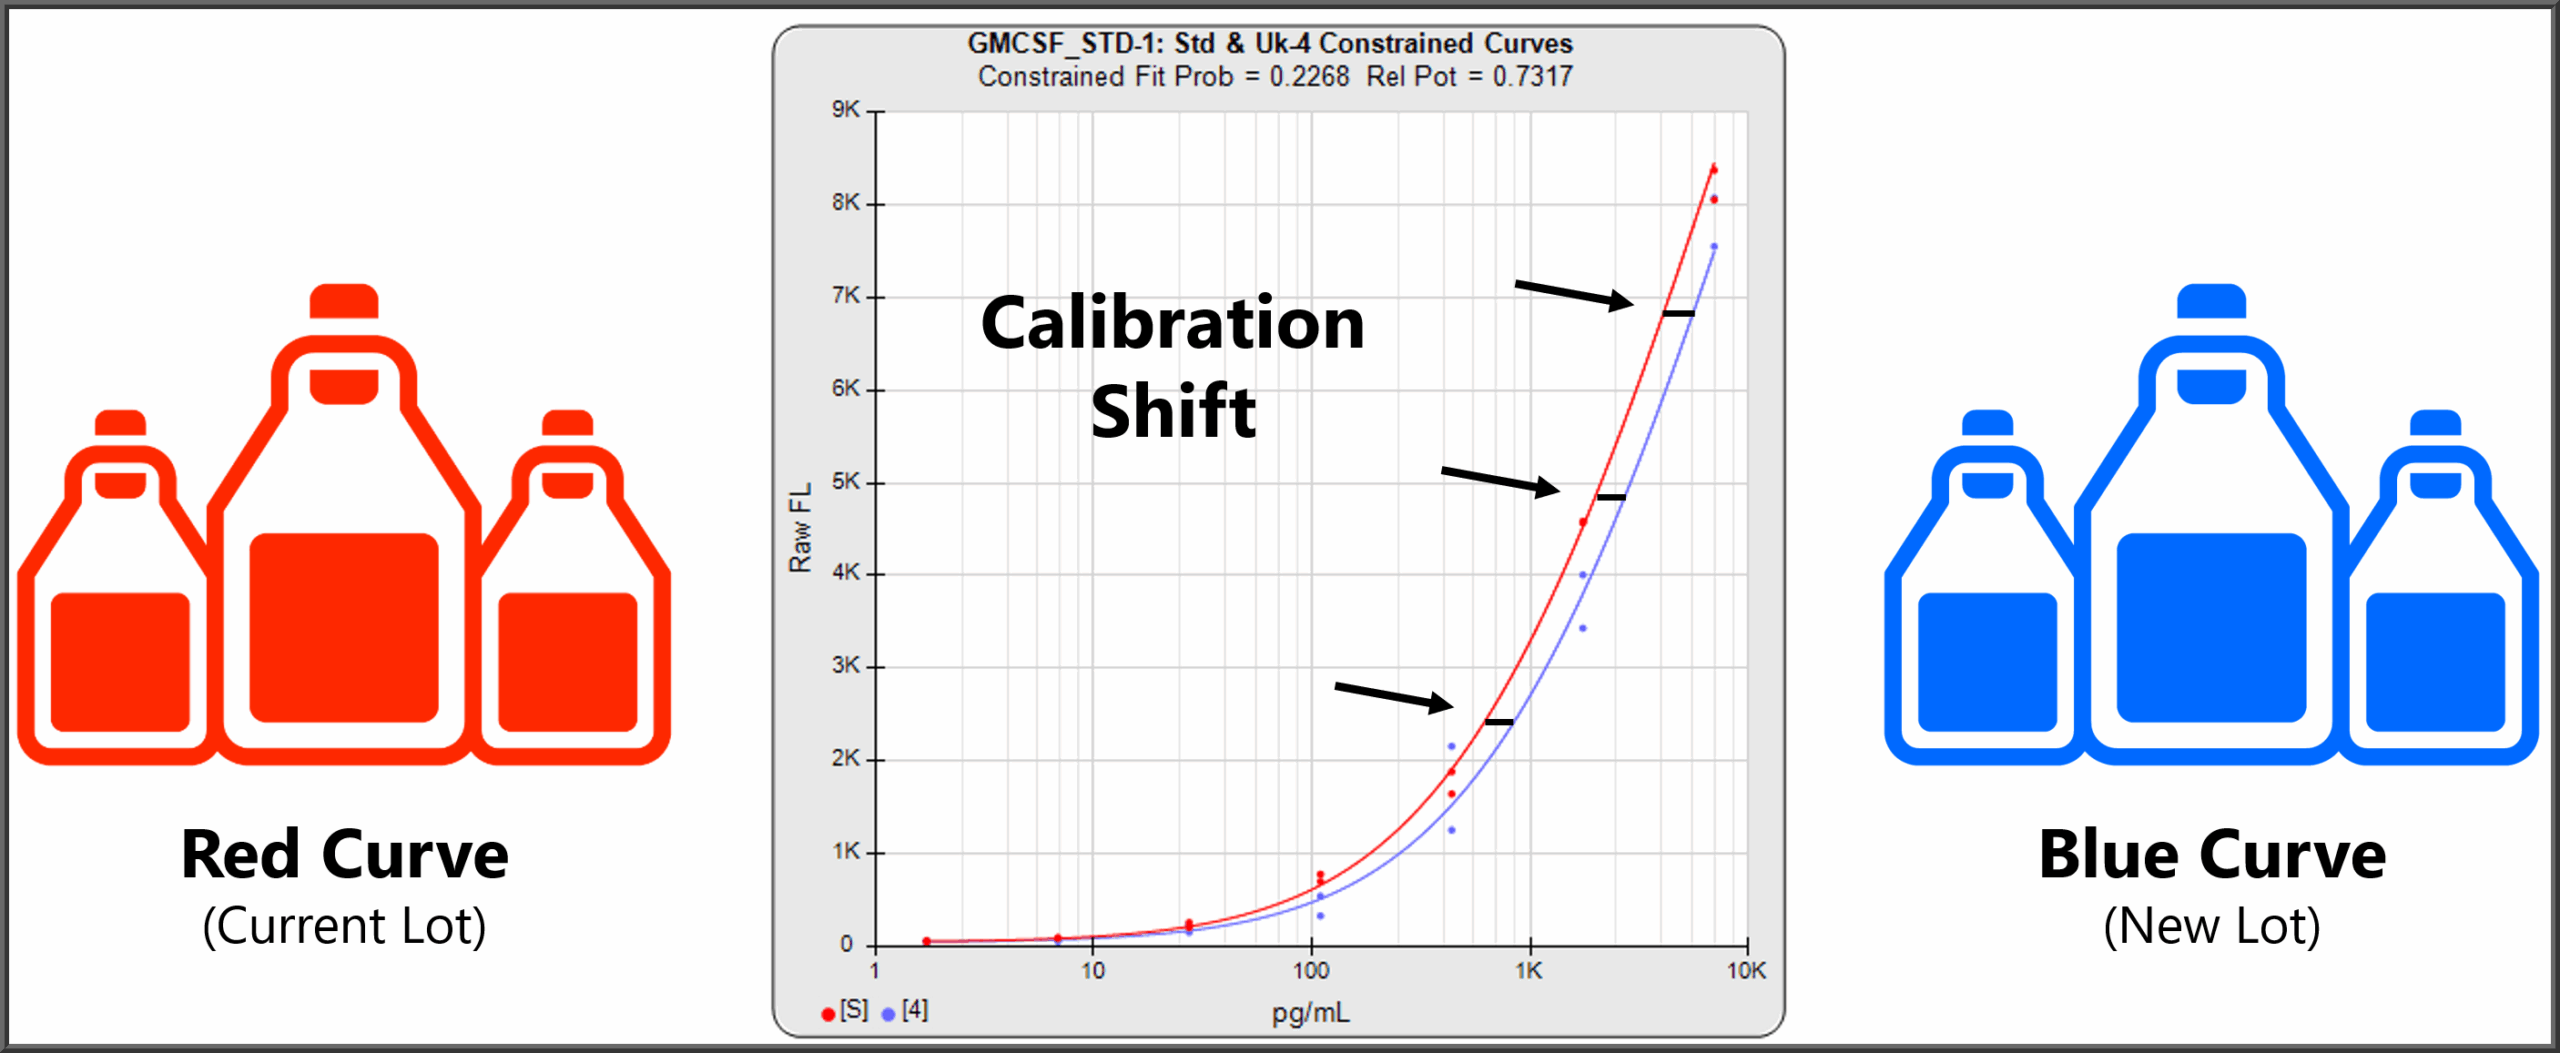
For lot-to-lot analysis, STATLIA MATRIX can compute the parallelism between the standard curves from different lots of the same analyte. By comparing the parallelism (or similarity) of the standard curves, the parallelism, or lack of it, shows how closely the chemistries of the two lots perform.
To determine if there is a calibration shift between lots, the distance along the X axis between standard curves is also computed. For this computation, the standard curves from the two lots are constrained to have exactly the same shape, as recommended in the literature, so that an accurate calibration shift value can be computed. The calibration shift between lots, also called the relative potency, shows the difference in results that the same unknown specimens would have if run in both lots.
The software also automatically ignores replicate precision outliers, residual outlier replicates too far from the curve, or nonmonotonic hooks at the high or low end of each analyte’s standard curve.
Easily Analyze Multiplex (or Singleplex) Assays
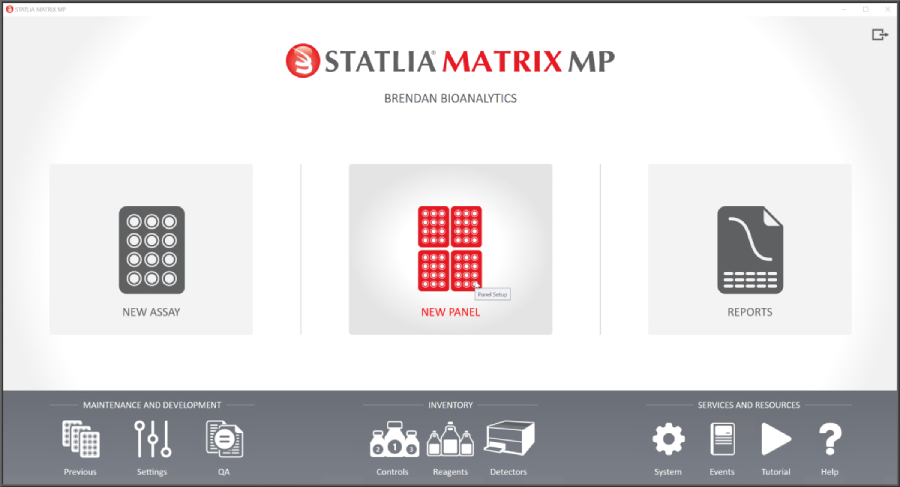
Select New Panel (Multiplex) or New Assay (Singleplex)
All Data and Settings Saved in Database for Each Multiplex Run
Import a raw data file and click compute. The software does the rest. Summary report provides an informative overview of each analyte’s performance for quick review. Results can be automatically exported to a LIM system, with or without review before being sent. Review additional analysis of each panel or analyte as needed with customized reports. Detailed analysis of each analyte with all data, analysis, and results easily accessible from the software’s Microsoft SQL Server database.


