Potency Curve Dilutions for Test 076EPotency
Optimization of Curve Dilution Concentrations for Relative Potency Test 076EPOTENCY
Question
What are the optimal dilution concentrations to use with the potency test 076EPOTENCY (test name and other identifying information have been changed)?
Analysis
ALL DILUTIONS INCLUDED
A 30-assay pool with 147 unknown test samples between them were computed with 5PL RSSEnonpar Method (Residual Parallelism) and 4PL Equivalence Method (Confidence Interval Parallelism). The initial series had 8 dilutions with a 6:1 step factor each from 0.031 – 8700 ng/mL. The metrics and graphs presented here are from STATLIA MATRIX’s Performance Analysis reports.
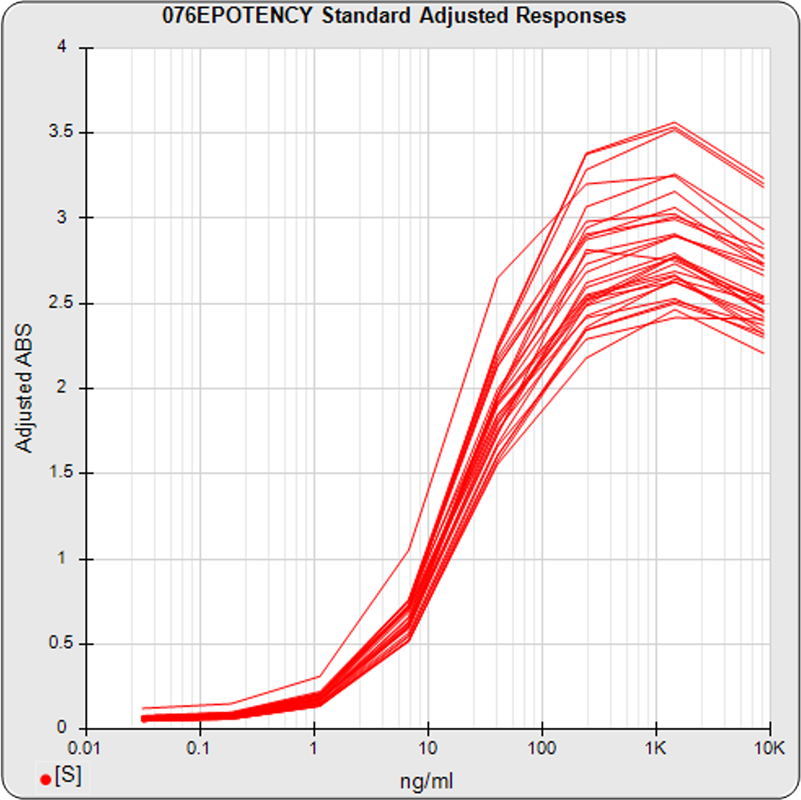
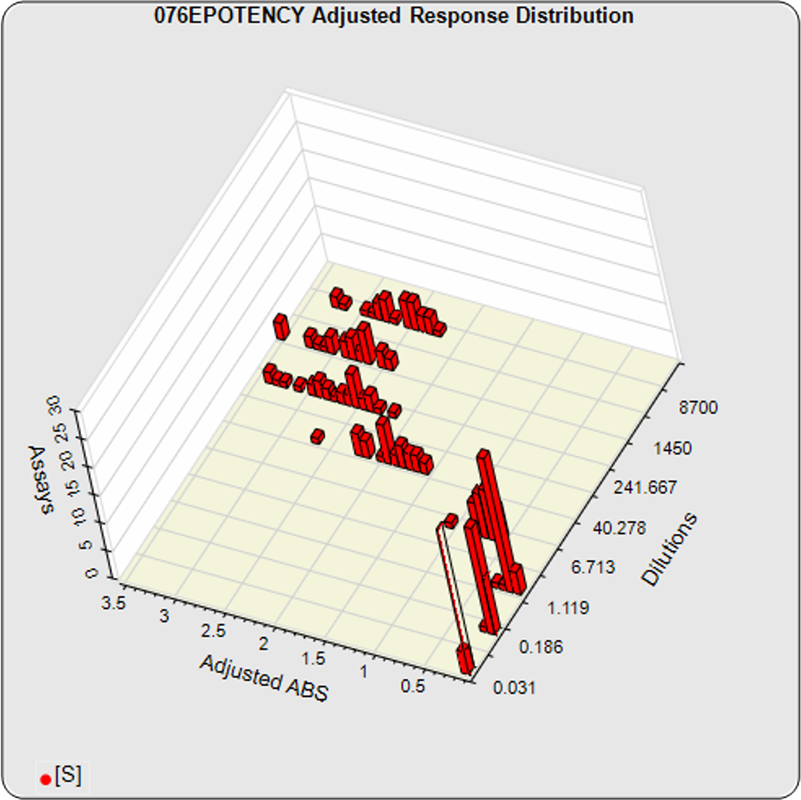
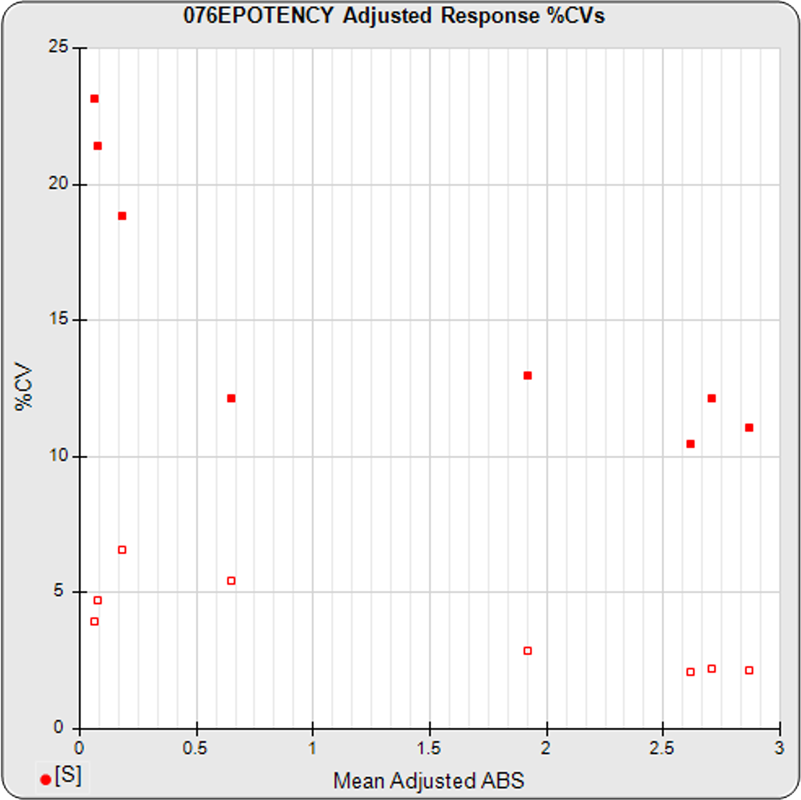
The linked standard adjusted responses (left graph) and standard dilution response distributions (center graph) show a substantial hook at the high dilution and a saturated response plateau at the lowest dilutions. The inter-assay %CV of the lowest 3 dilutions (right graph, solid squares) is double that of the other dilutions, indicating the last dilution response is mostly noise with little biological kinetics contribution.
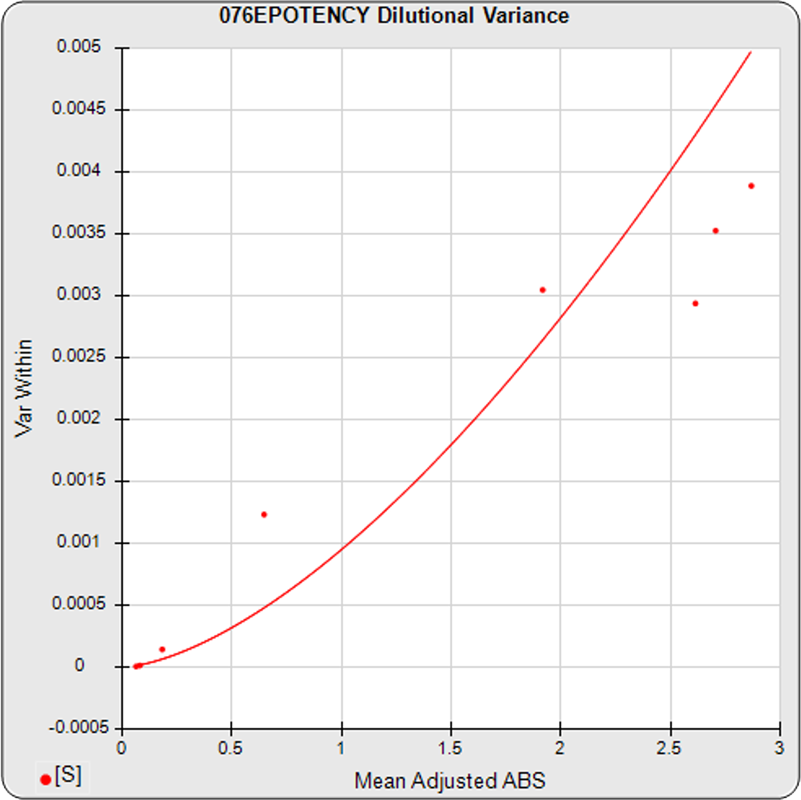
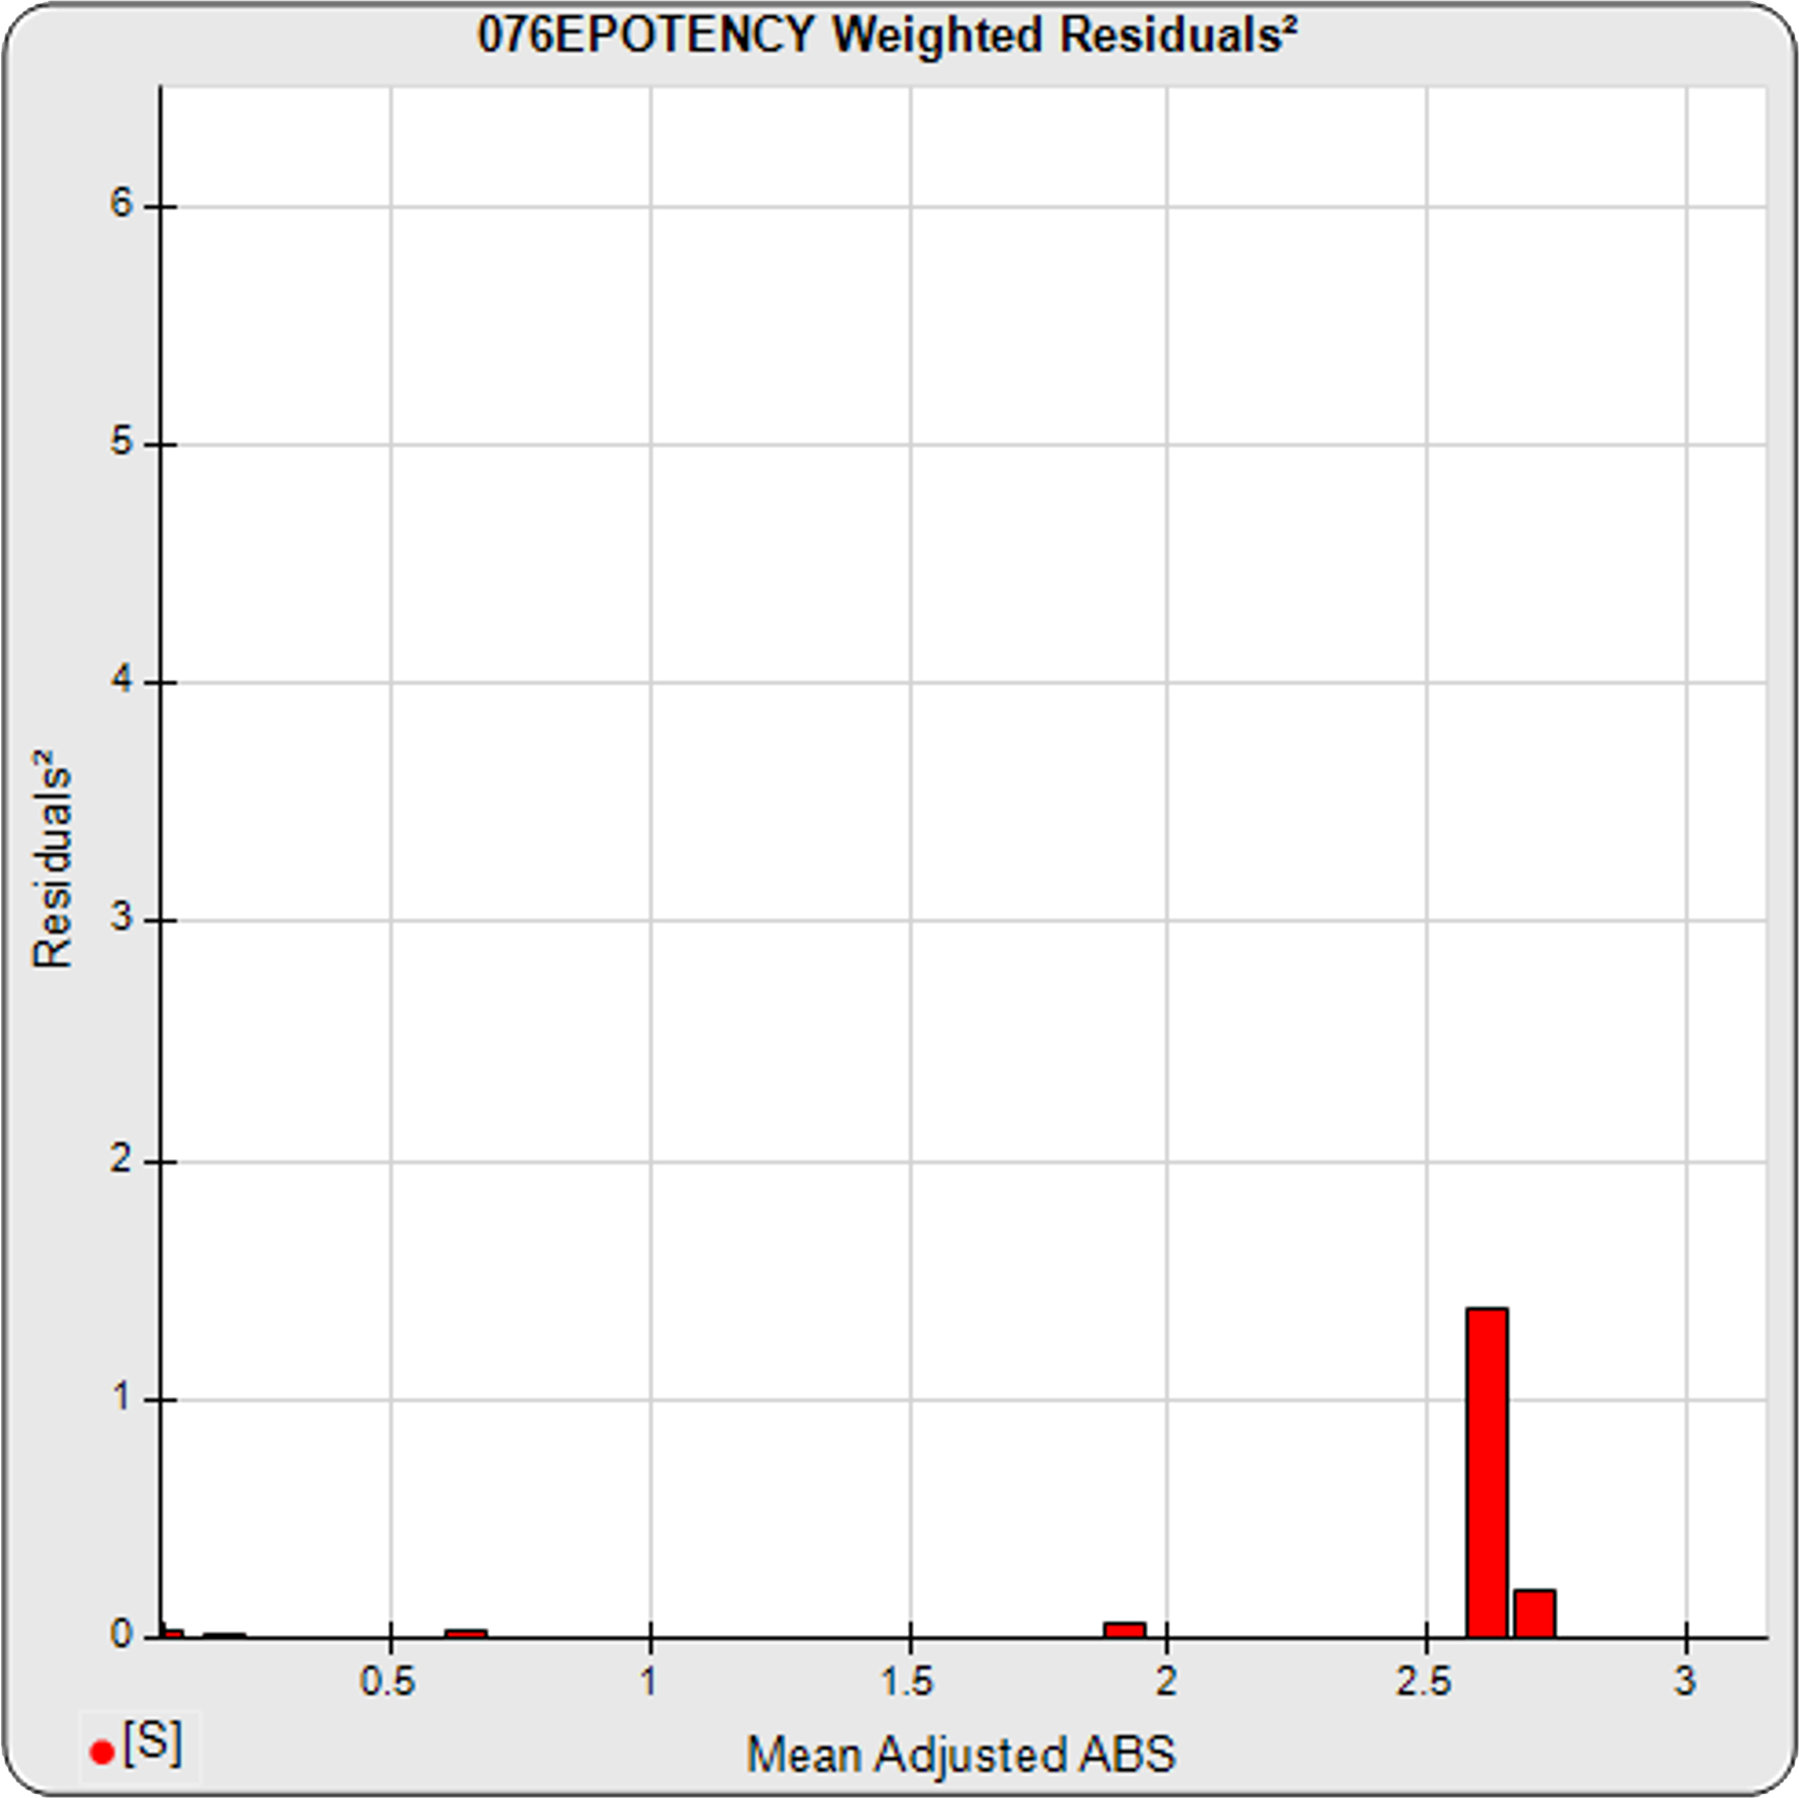
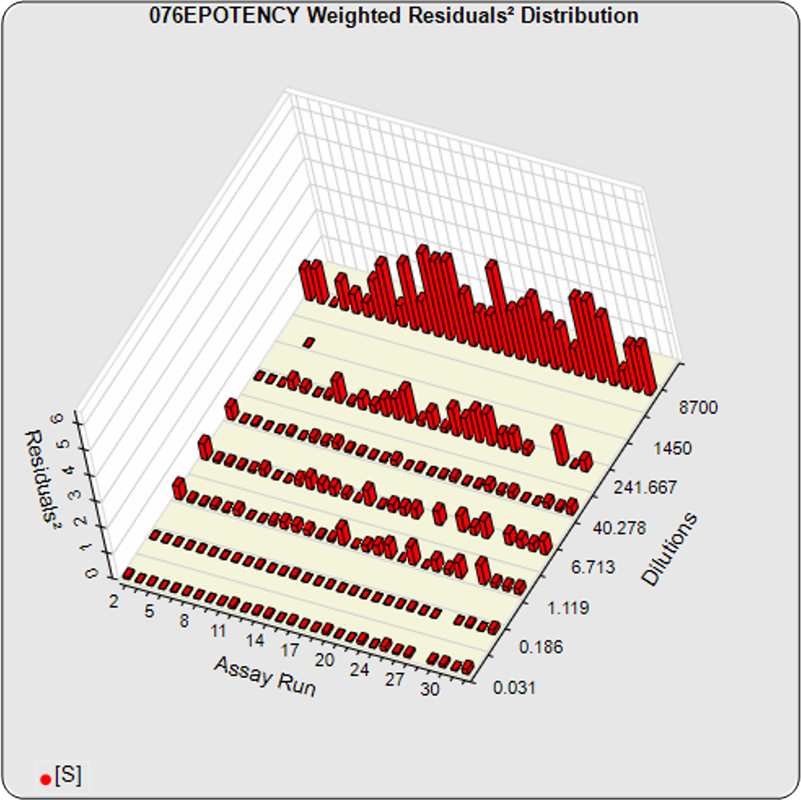
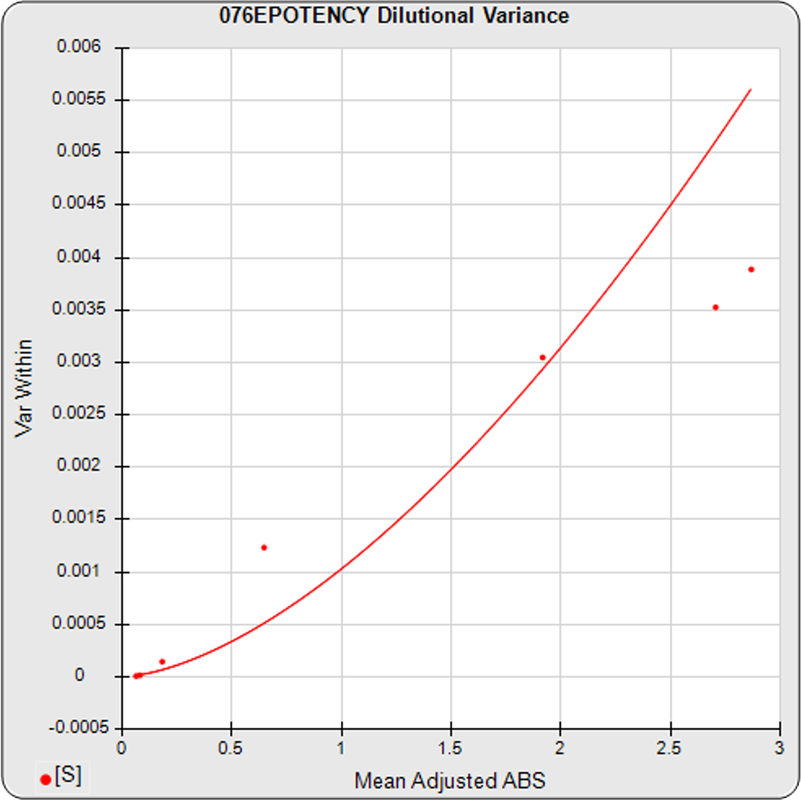
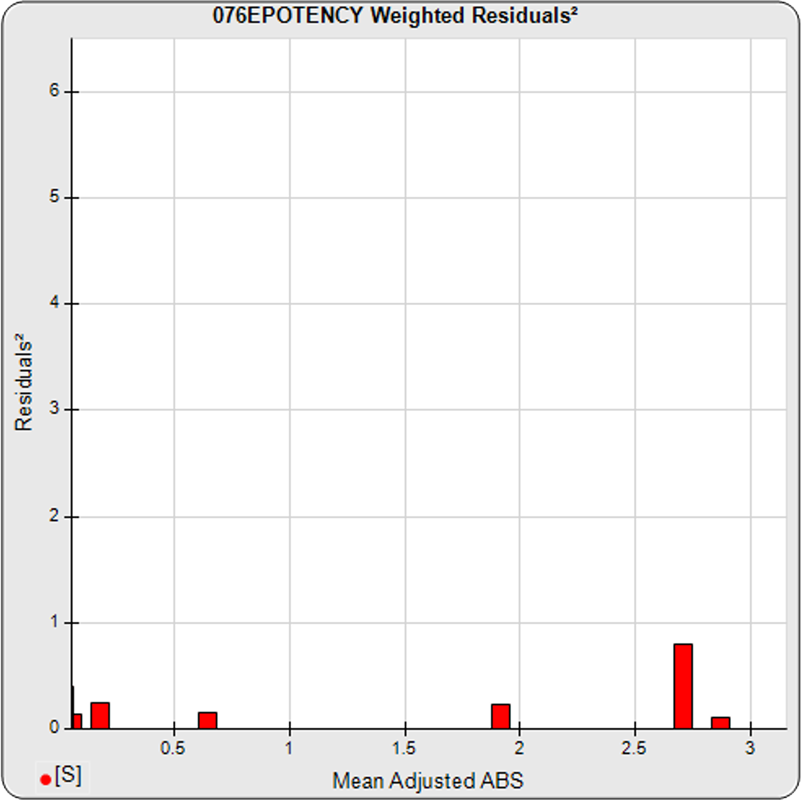
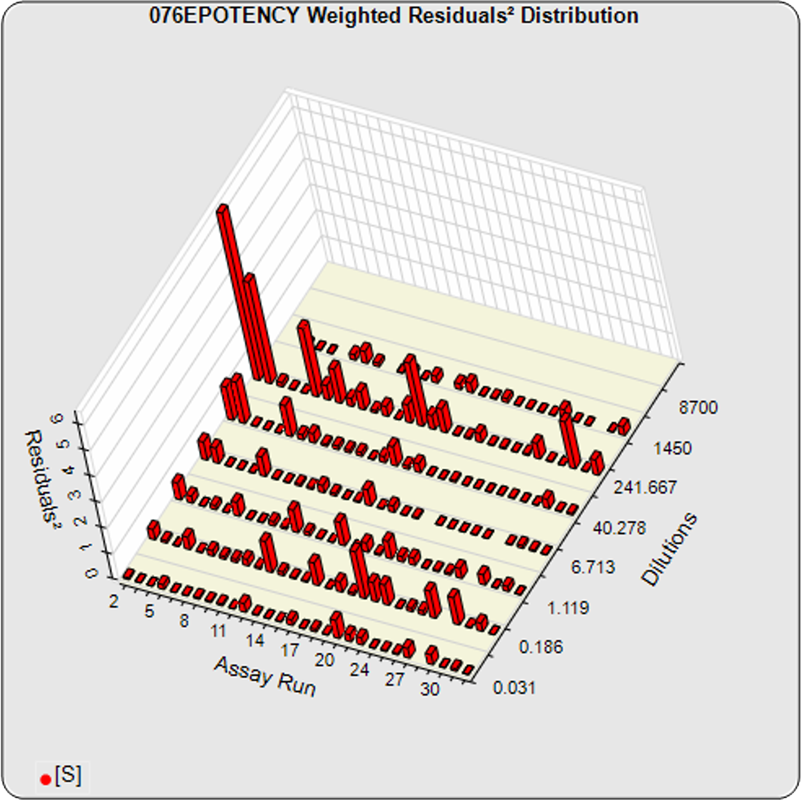
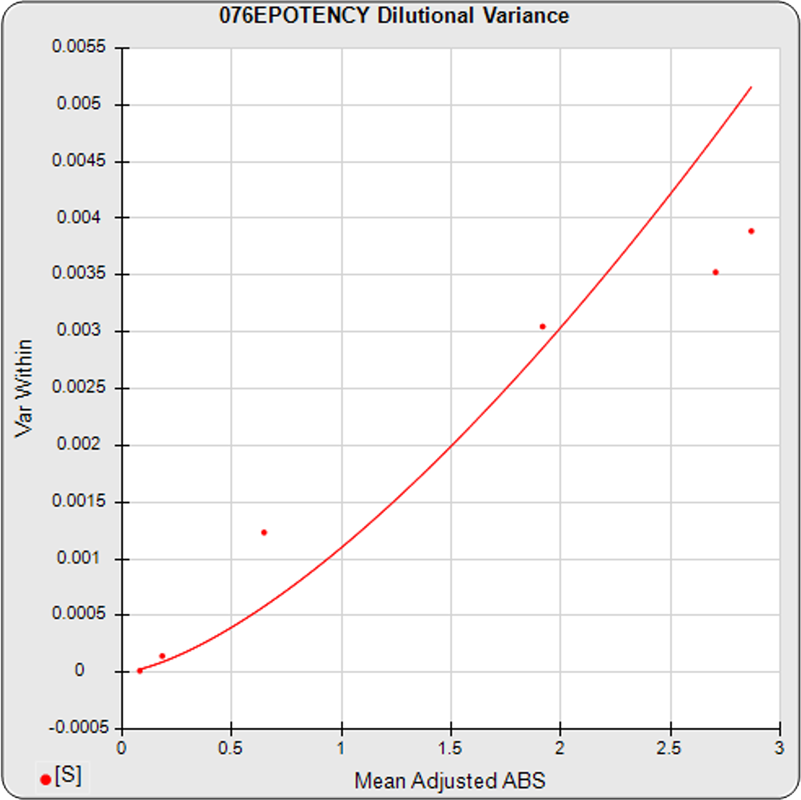
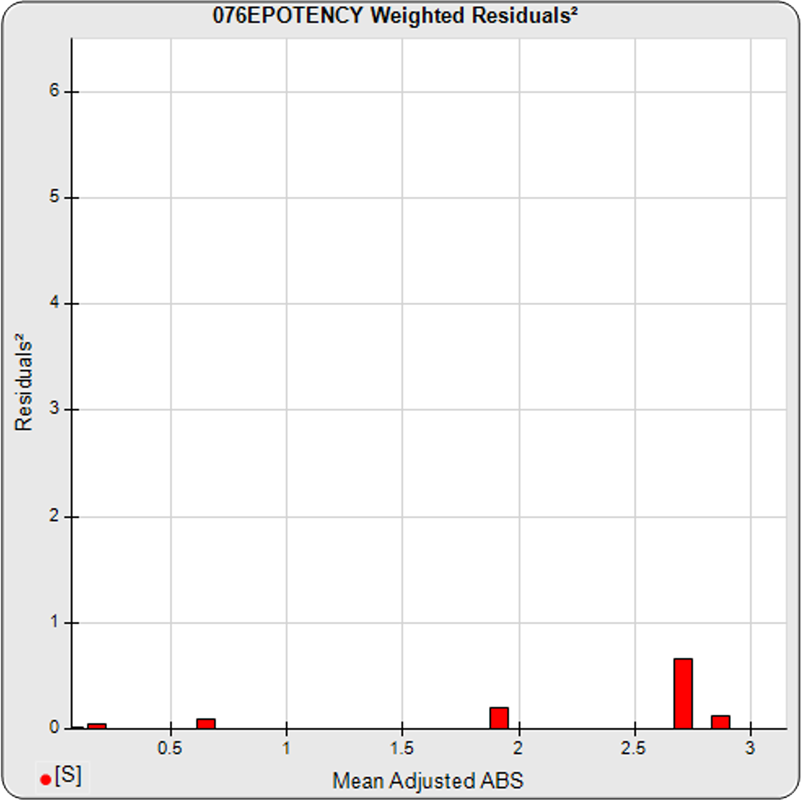
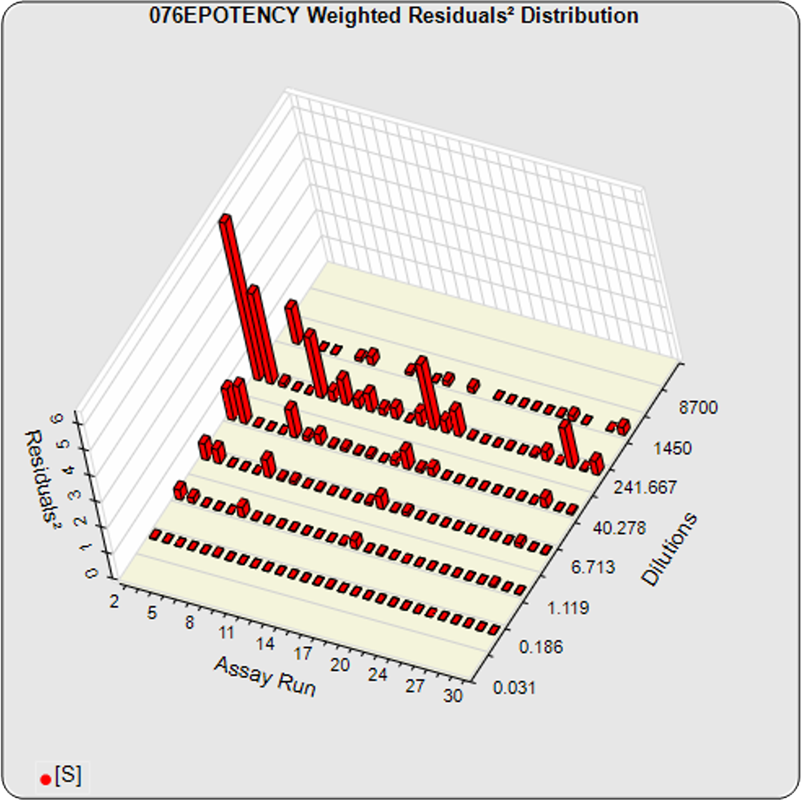
The dilutional variance regression used to determine the weighting was 0.0001 · Y1.57 (left graph). The weighting residual error (see Tech Note: Curve Weighting) was high for the 5PL (7.00) and the 4PL (7.94), indicating that neither the 5PL nor the 4PL could fit the data well. The distribution of the average weighted residuals2 of each standard dilution (center graph) shows most of the residual error is at the high dilutions. This graph, and the weighted standard residuals2 distribution (right graph), shows a very unbalanced distribution caused by the high response dilution. Missing weighted standard residuals2 are residual outliers and were ignored.
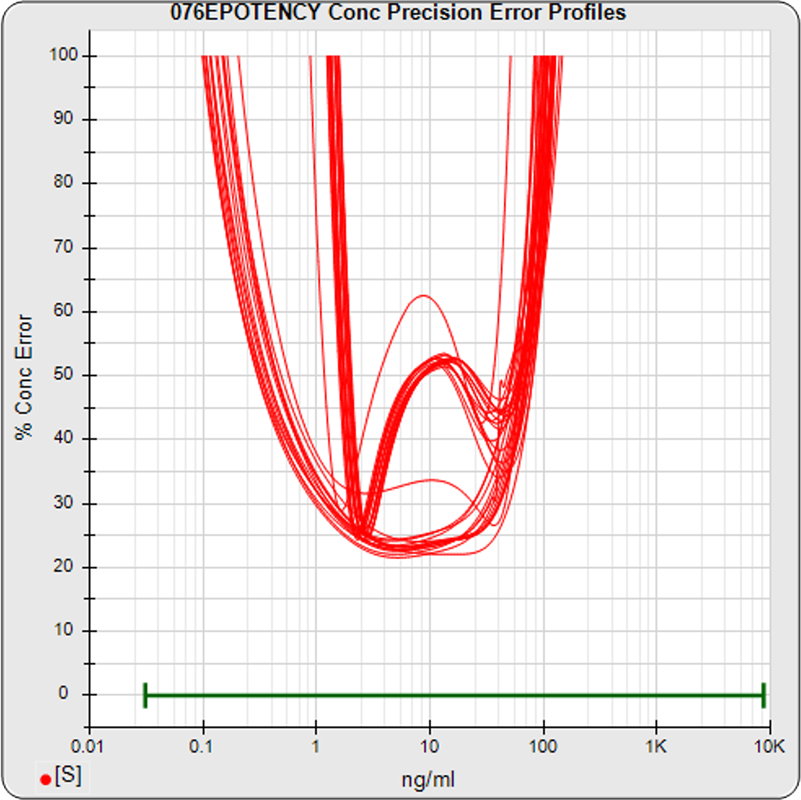
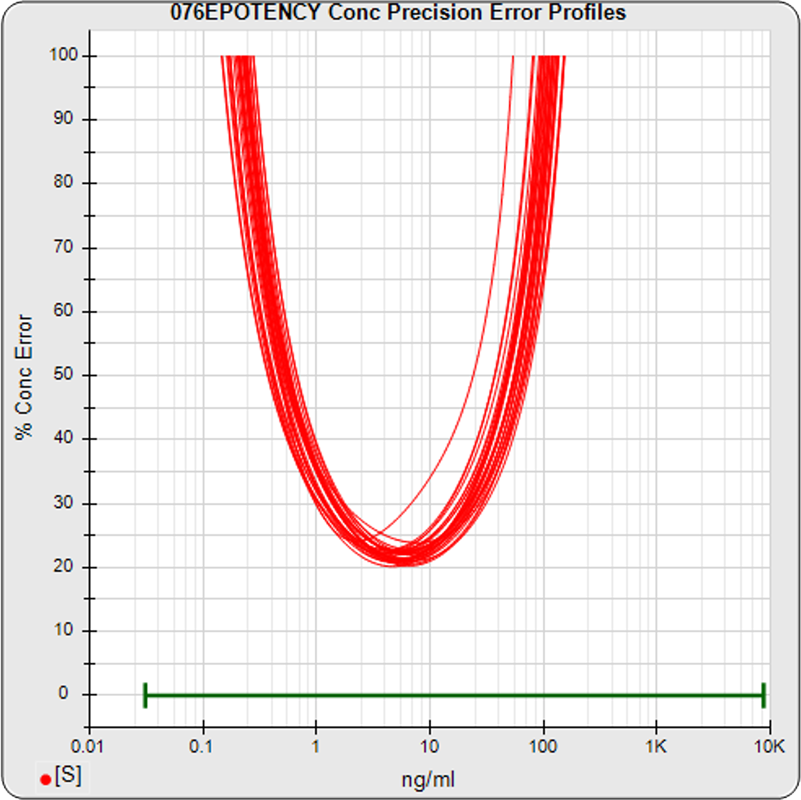
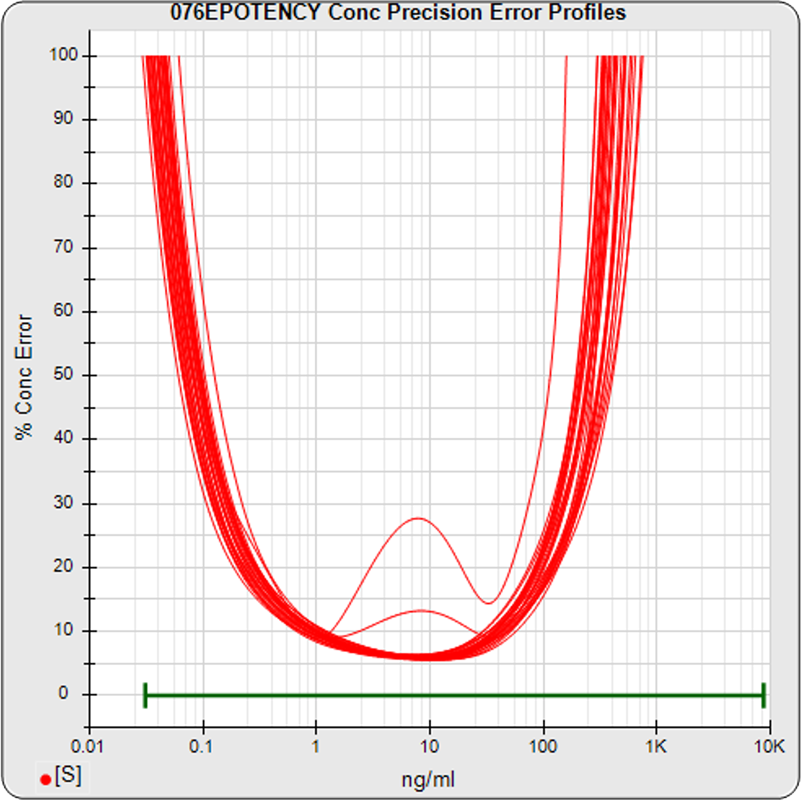
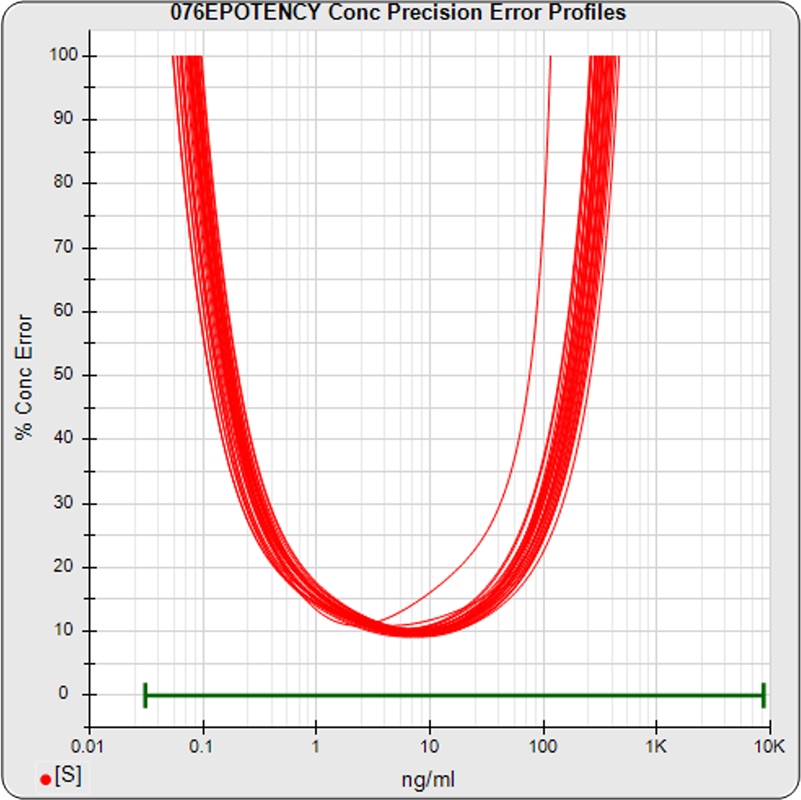
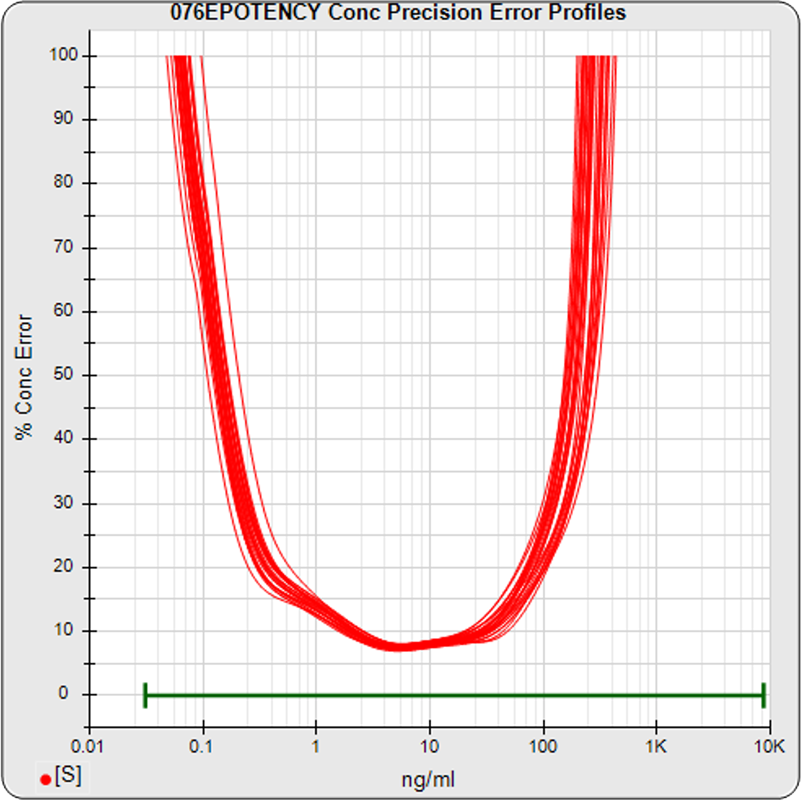
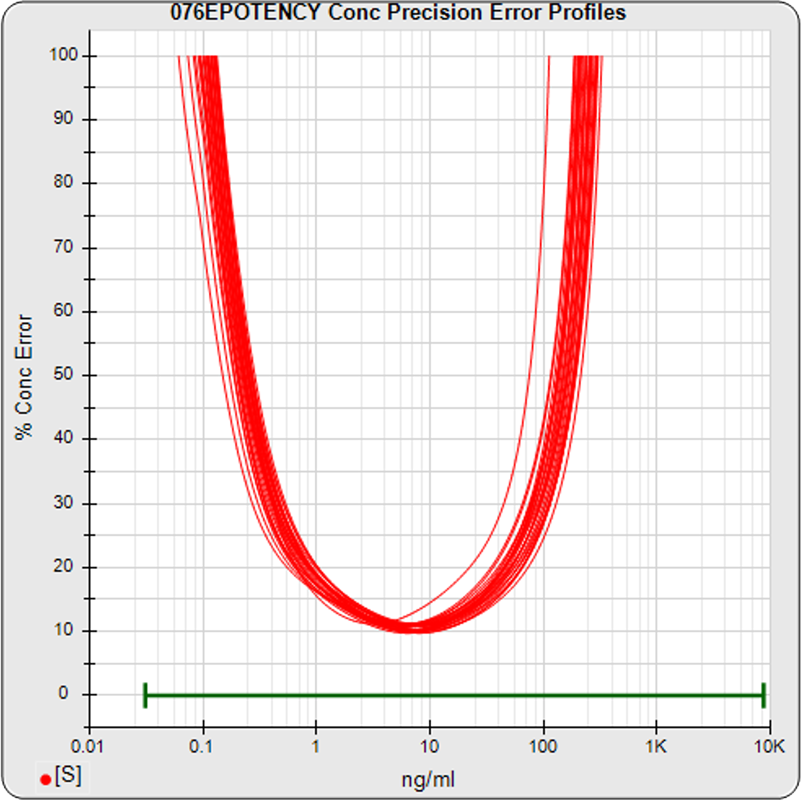
The median limits of quantitation of the standard curves at a 100% precision error threshold is 0.12 to 89.8 ng/mL (5PL) and 0.32 to 82.7 ng/mL (4PL), as shown in these precision error profile graphs of the concentration errors along the standard curves (see Tech Note: LOQs, LODs). The standard dilution range is in green. This indicates the range of effective biological activity for this potency test. The hook at the high end affects the 5PL error profile (left graph) more than it does the 4PL (right graph). This is because the shapes at each end are independent in the 5PL, but the 4PL constrains both ends to the same symmetrical shape, so one end acts as a restraint on the other end. The concentration error at the lowest point is 20% for both the 5PL and the 4PL regressions.
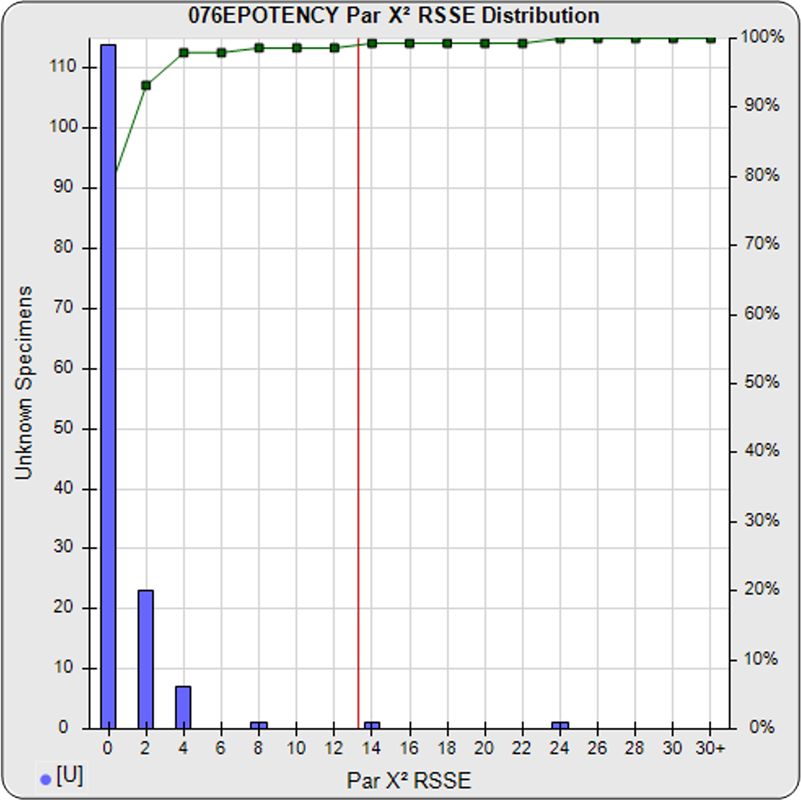
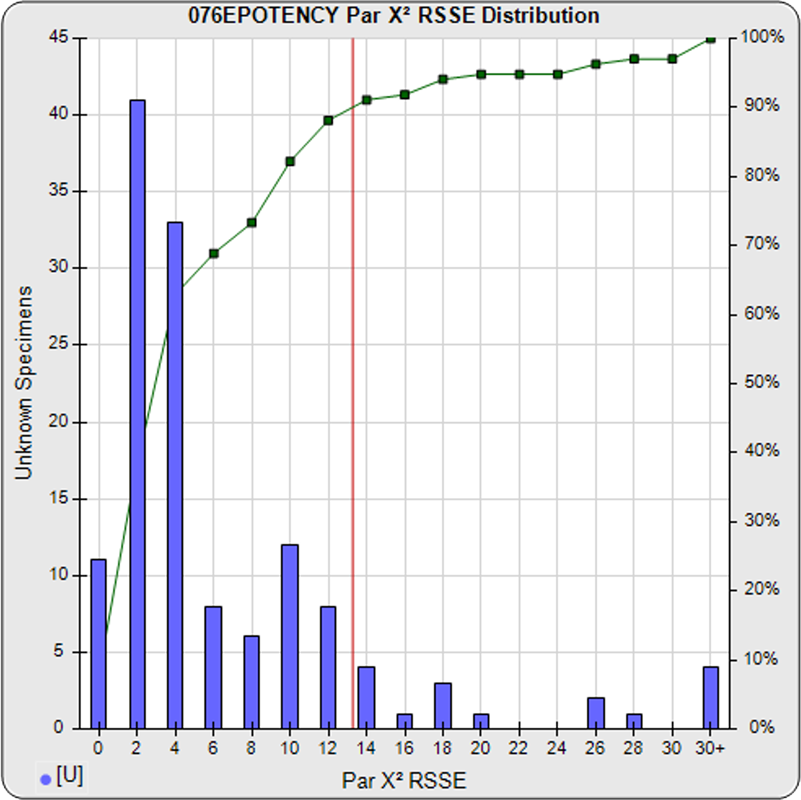
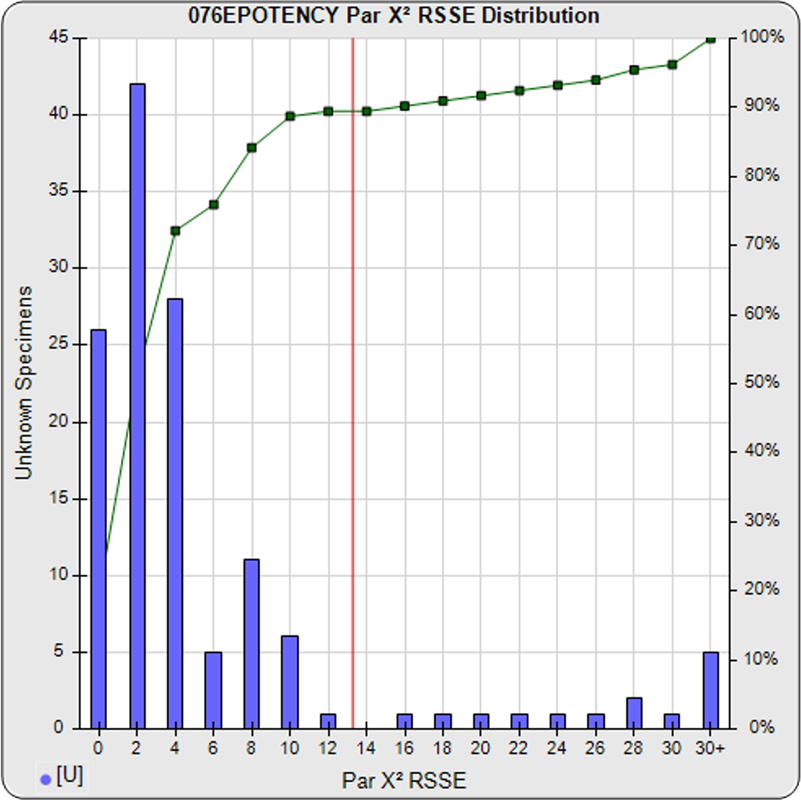
When computed using the RSSEnonpar Method (direct parallelism measure), the distribution of 147 unknown test sample nonparallel RSSEs was skewed very low (left graph), with a median nonparallel RSSE of 0.38 and corresponding chi-square probability median of 0.9844. The median nonparallel RSSE from a distribution of parallel test samples should equal the degrees of freedom of 4 (P-1) and the corresponding expected median chi-square probability should be 0.5. The very low RSSE median was because of the large, unbalanced residual error.
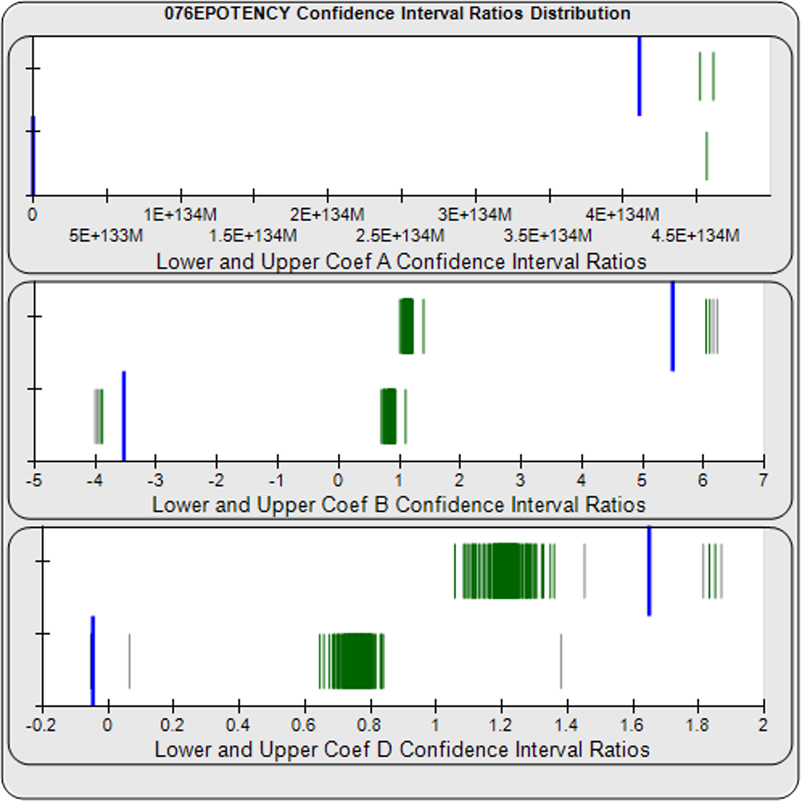
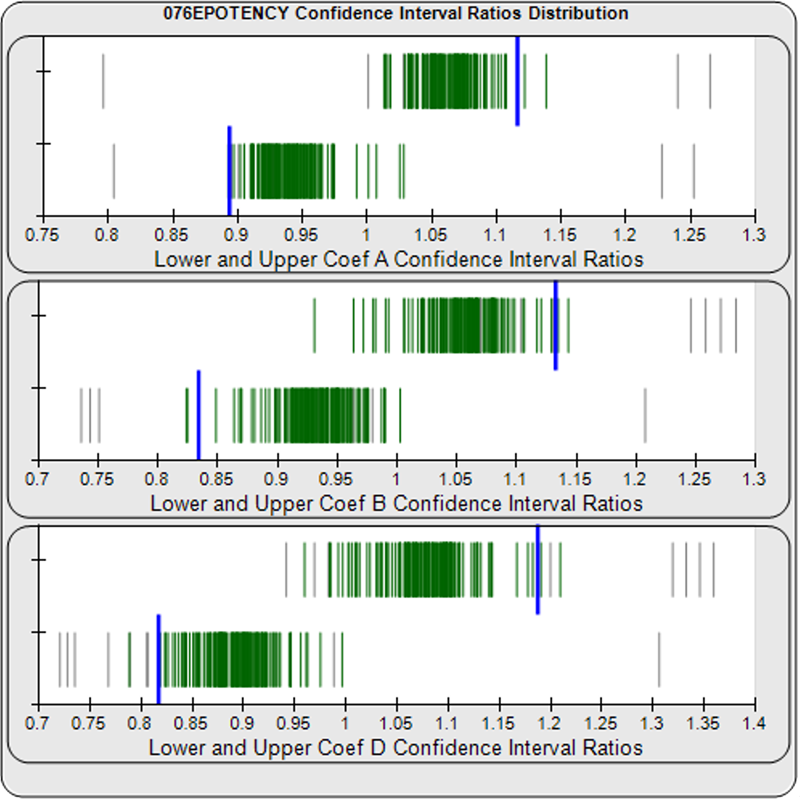
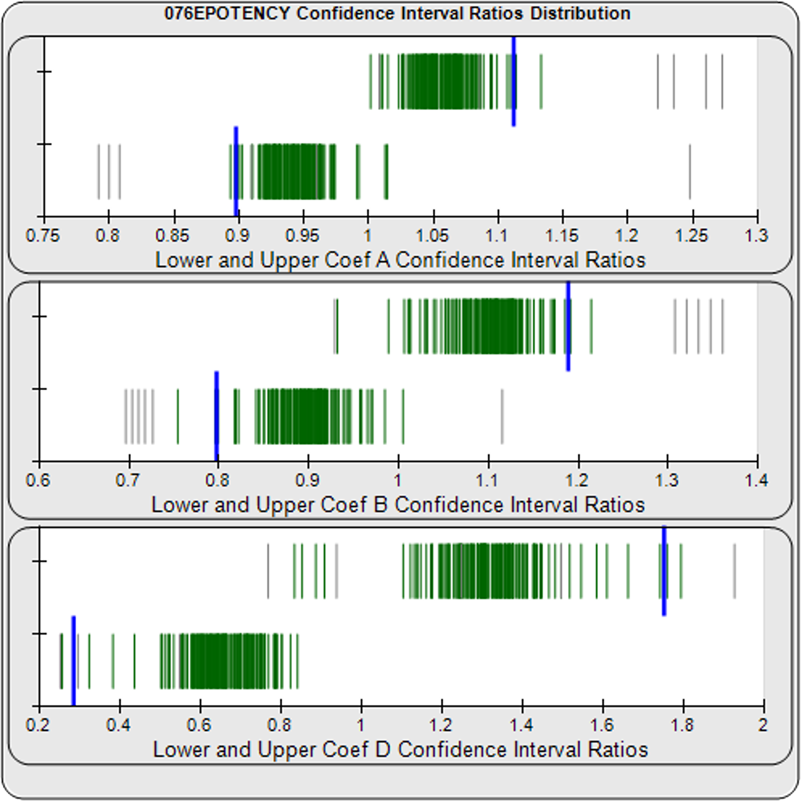
When computed using the Equivalence Method, the ratio deltas of the 147 unknown test sample/ reference standard lower and upper confidence interval limit ratio deltas (green lines) of the 4PL coefficients are shown in the right graph. Confidence intervals were determined at 0.9 confidence level using the Monte Carlo Method, which is more stable and precise than linear approximation or profile method estimates. Gray lines are delta ratios from critically failed standard or unknown curve regressions or critically failed parallelism determinations. The upper and lower goalpost borders, plotted as blue vertical lines, were computed at the 99th percentile of the respective pooled assay ratio deltas after excluding failed deltas. The upper asymptote Coef A (0.90 – 4.11E+140) and slope of the inflection point Coef B (-3.53 – 5.49) ratio deltas were too scattered to obtain usable goalpost borders. The lower asymptote Coef D (-0.05 – 1.65) were less scattered but still quite wide.
HIGHEST DILUTION IGNORED
The reference standard and test sample regressions were computed for all of the pooled assays with the 8700 ng/mL high dilution ignored.
Masking the high 8700 ng/mL dilution reduced the dilutional variance error and the weighting residual error dramatically. The dilutional variance regression was 0.001·Y1.61 (left graph). The weighting residual error was much lower for the 5PL (0.52 vs 7.00) and the 4PL (1.46 vs 7.94). The distribution of the average weighted residual2 of each standard dilution shows the residual error more evenly distributed (center graph). The weighted residuals2 distribution (right graph) shows a balanced distribution of all the standard dilutions.
The median limits of quantitation of the standard curves widened at both ends to 0.05 to 350 ng/mL vs 0.12 to 89.8 ng/mL for the 5PL (left graph) without the high, hooked dilution. The usable range of the 4PL was also extended, though not as far (0.09 to 250 ng/mL vs 0.32 to 82.7 ng/mL). The concentration error at the lowest point is reduced from 20% for both to 5% in the 5PL and 10% in the 4PL regressions, respectively. A smaller error will narrow the confidence limits of the relative potency estimates.
When computed using the RSSEnonpar Method (direct parallelism measure) without the high dilution in the reference standard or test samples, the distribution of nonparallel RSSEs exhibited the expected chi-square distribution (left graph). The mean nonparallel RSSE was 3.63 and the corresponding chi-square probability median was 0.4575. These median nonparallel RSSE and chi-square probability values are close to their expected values of 4 (P-1 degrees of freedom) and 0.5, respectively.
When computed using the Equivalence Method without the high dilution in the reference standard or test samples, the goalpost borders computed at the 99th percentile of the lower and upper confidence limit ratio deltas for the 4PL upper asymptote Coef A (0.89 – 1.12), the slope of the inflection point Coef B (0.83 – 1.13), and lower asymptote Coef D (0.82 – 1.19) were much more tightly spread around an expected ratio of 1.
LOWEST AND HIGHEST DILUTIONS IGNORED
The reference standard and test sample regressions were computed for all of the pooled assays with the 0.031 and 8700 ng/mL dilutions ignored.
Masking the low 0.031 and high 8700 ng/mL dilutions also reduced the dilutional variance error and the weighting residual error dramatically. The dilutional variance regression was 0.001·Y1.47 (left graph). The weighting residual error was also lower for the 5PL (0.52) and the 4PL (1.46), similar to the effect of ignoring just the high dilution. The distribution of the average weighted residual2 of each standard dilution shows the residual error more evenly distributed (center graph). The weighted residuals2 distribution (right graph) shows a balanced distribution of all the standard dilutions.
The median limits of quantitation of the standard curves widened at both ends to 0.09 to 235 ng/mL for the 5PL (left graph) when the lowest plateaued and high hooked dilutions were ignored. The usable range of the 4PL was also extended, though not as far (0.16 to 199 ng/mL). The concentration error at the lowest point is reduced to 7% in the 5PL and 10% in the 4PL regressions, respectively. These are wider than when none of the dilutions were ignored, but the LOQs were not as wide or the error as low as when only the high, hooked dilution was masked.
When computed using the RSSEnonpar Method (direct parallelism measure) without the lowest and highest dilutions in the reference standard or test samples, the distribution of nonparallel RSSEs exhibited a chi-square distribution (left graph). The mean nonparallel RSSE was 2.62 and the corresponding chi-square probability median was 0.6224. While these median values are substantially better than those from the regressions with all of the dilutions, they are not as close to the expected values as those regressions with only the high dilution masked.
When computed using the Equivalence Method without the lowest and highest dilutions in the reference standard or test samples, the goalpost borders computed at the 99th percentile of the lower and upper confidence limit ratio deltas for the 4PL upper asymptote Coef A (0.90 – 1.11) and the slope of the inflection point Coef B (0.80 – 1.19) were similar to those from regressions with only the high dilution masked. However, the lower asymptote Coef D (0.28 – 1.75) ratio deltas was more widely spread around 1 than when only the highest dilution was masked.
Summary
ALL DILUTIONS INCLUDED
The potency test 076EPOTENCY assay results should not be considered reportable when all dilutions are used. The RSSEnonpar Method nonparallel RSSEs are skewed so low that many test samples that are not similar would still pass. The Equivalence Method parallel deltas are also too widely dispersed to yield goalpost margins that could identify test samples that are not similar.
HIGHEST DILUTION IGNORED
Ignoring the high hooked dilution dramatically changed the performance of this potency test. The 5PL and 4PL weighting residual errors were reduced back to normal levels. The limits of quantitation were more than doubled at both the low end and the high end. This is important for potency tests because many differences between substances are only observable at low or high doses. The lower error level for all doses provides more sensitivity for detecting similarity differences and will also generate more accurate relative potency estimates with tighter confidence limits. The RSSEnonpar Method distribution of nonparallel RSSE (and their corresponding chi-square probabilities) were very close to their expected values. The Equivalence Method distributions were good ranges for all three 4PL coefficients.
LOWEST AND HIGHEST DILUTIONS IGNORED
Ignoring both end dilutions also dramatically improved the performance of this potency test. The 5PL and 4PL weighting residual errors were almost identical to those with the one dilution ignored. The limits of quantitation were also considerably widened, and the error levels lowered from regressions generated from the full dilution series, although not as wide or low compared to the regressions with only the high dilution ignored. The RSSEnonpar Method distribution of nonparallel RSSEs with both dilutions ignored, although much closer to expected than with all dilutions, was not as close to the expected values as when only the high dilution was masked. The Equivalence Method ratio delta ranges of the upper asymptote and the slope of the inflection point coefficients were similar to regressions where only the high dilution was masked, but the low asymptote ratio delta range was markedly wider.
RECOMMENDATION
The recommendation for this potency test 076EPOTENCY is to compute the regressions using only the 7 dilutions from 0.031 – 1450 ng/mL and to omit the highest 8700 ng/mL dilution. All 543 assays from this potency test should be recomputed using only these 7 dilutions and these results should replace the results from all 8 dilutions.