Equivalence Method Parallelism
STATLIA MATRIX Provides Accurate Confidence Limit Determinations for Your Equivalence Method TestsSee your data in STATLIA MATRIX.
Equivalence Method Parallelism Is Precise and Reliable
The Equivalence Method (Confidence Interval Parallelism) is a measure of the similarity between the asymptotic endpoints plus the slope of the inflection point of two 4PL curves or the slopes of two lines. The Equivalence Method compares the deltas of the confidence interval limits (ratio or difference) of the Unknown / Standard A, B, and D coefficients of 4PL curves or the B coefficient of linear regressions. The deltas must all fit within defined goalpost borders to be considered parallel. STATLIA MATRIX computes stable and precise confidence intervals for each coefficient. The software also automatically computes goalpost borders from a specified percentile limit of your previous run assays, or you can use goalpost borders established by your laboratory.

Equivalence Method Parallelism Example of Parallel Curves (Test Sample Same as Reference Standard)
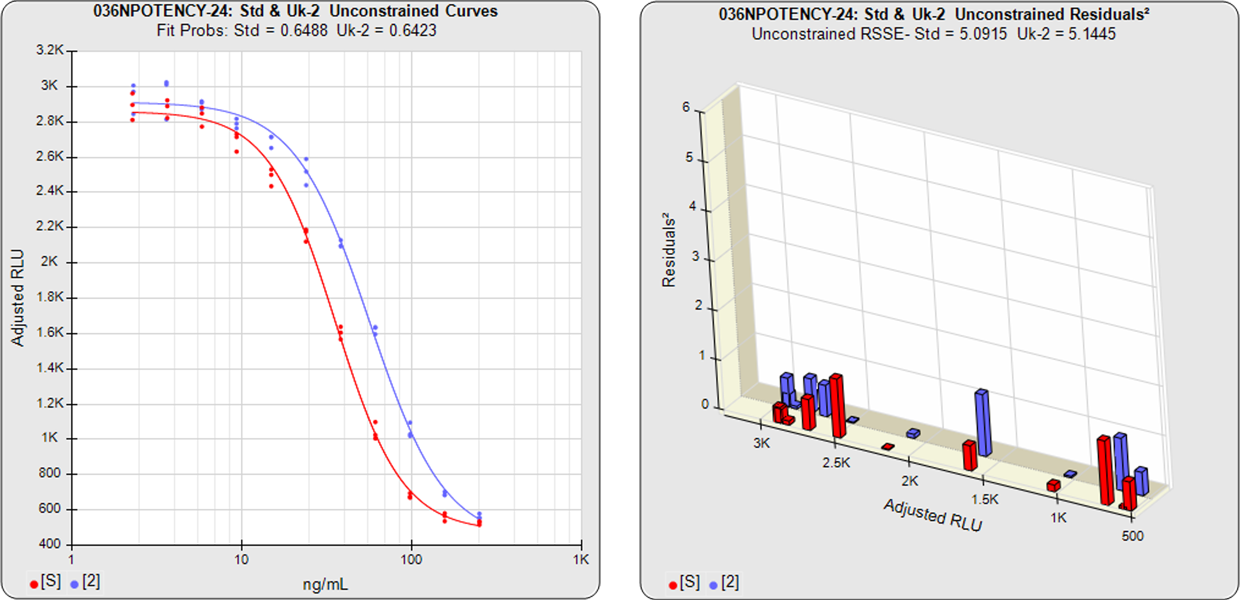
Unconstrained Curves
Constrained Curves
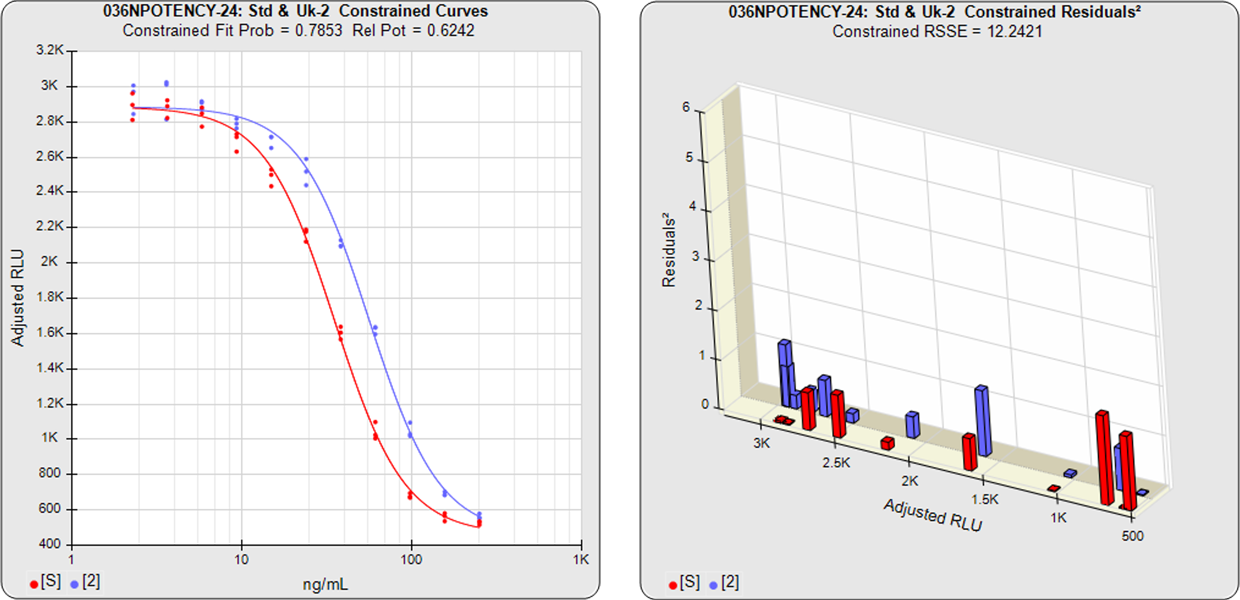
The graphs show the individual unconstrained and constrained curve goodness of fits.
In the unconstrained curves, the data from both curves are computed using separate 4PL curve fits. Linear regression can also be selected for linear data sets. The individual weighted residual sum of squares errors (RSSE) between each observed point and the curve is plotted on the weighted residual2 graphs. The residual graph allows bad dilutions to be easily identified. There are no bad dilutions in this example.
The relative potency and its confidence limits are determined from curves constrained to the same shape.
Parallelism Determination
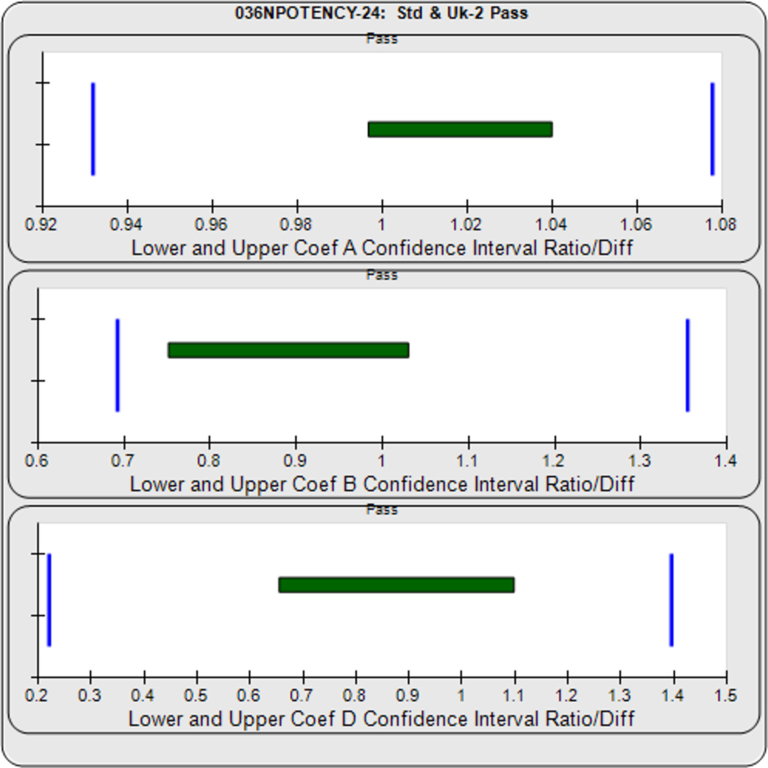
The deltas of the lower and upper confidence interval limits are computed as either ratios (this example) or differences of the Unknown / Standard A, B, D coefficients (4PL) or B coefficient (linear regression) of the unconstrained curves. Both the lower and upper deltas of all coefficients must be within their respective goalpost borders to pass.
The Equivalence Chart plots the lower and upper delta values as horizontal bars between blue goalpost borders. Bars are green when inside blue goalpost borders (pass) and red when outside (fail).
In this example, the upper asymptote (A), lower asymptote (D), and slope of the inflection point (B) confidence limit deltas are all within their respective goalpost borders and are shown as green. Therefore this test sample passes its parallelism test.
Relative Potency
The relative potency and its confidence limits are determined from curves constrained to the same shape. The relative potency in this example is 0.6242.
Equivalence Method Parallelism Example of Nonparallel Curves (Isomeric Impurity in Test Sample)
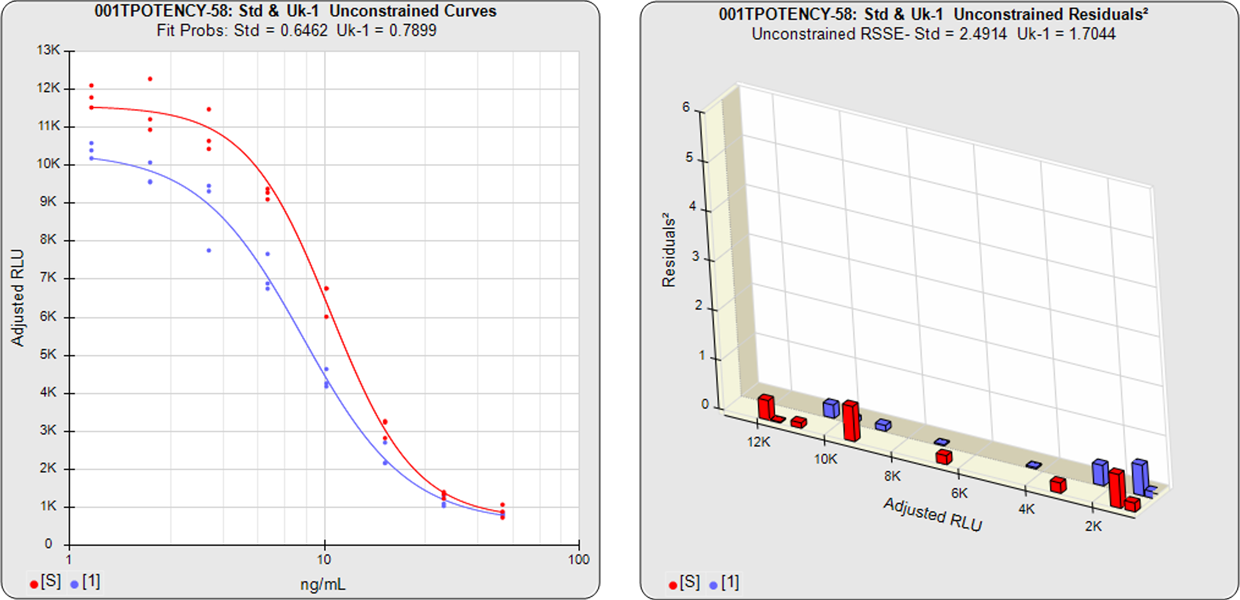
Unconstrained Curves
Constrained Curves
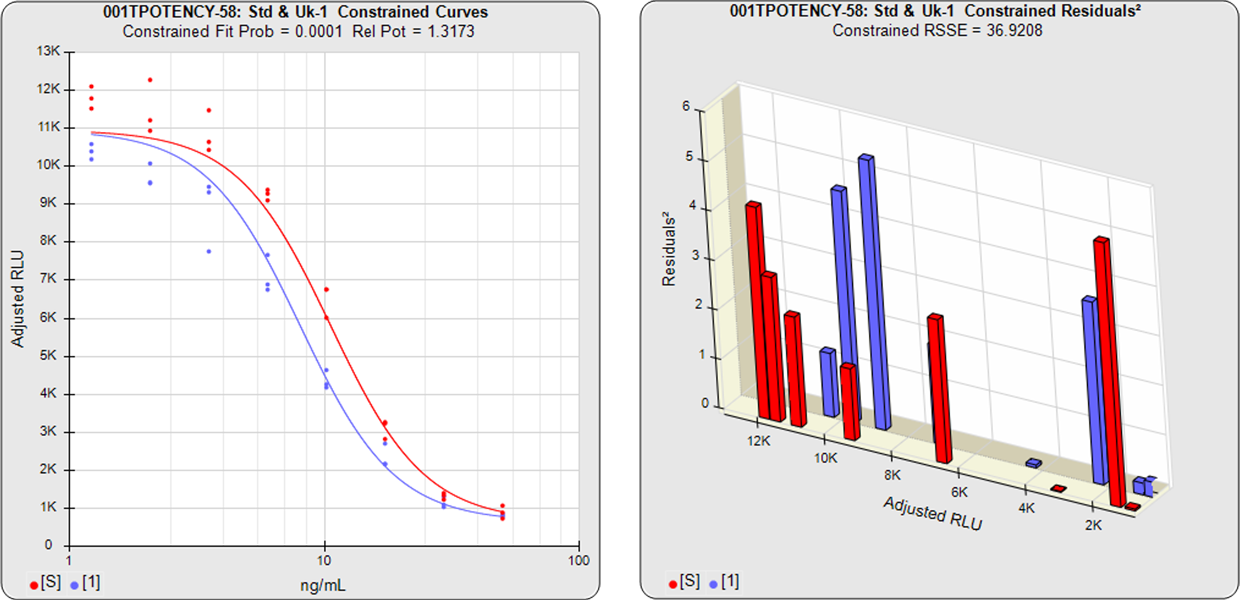
The graphs show the individual unconstrained and constrained curve goodness of fits.
In the unconstrained curves, the data from both curves are computed using separate 4PL curve fits. Linear regression can also be selected for linear data sets. The individual weighted residual sum of squares errors (RSSE) between each observed point and the curve is plotted on the weighted residuals2 graphs. The residual graph allows bad dilutions to be easily identified. There are no bad dilutions in this example.
The relative potency and its confidence limits are determined from curves constrained to the same shape.
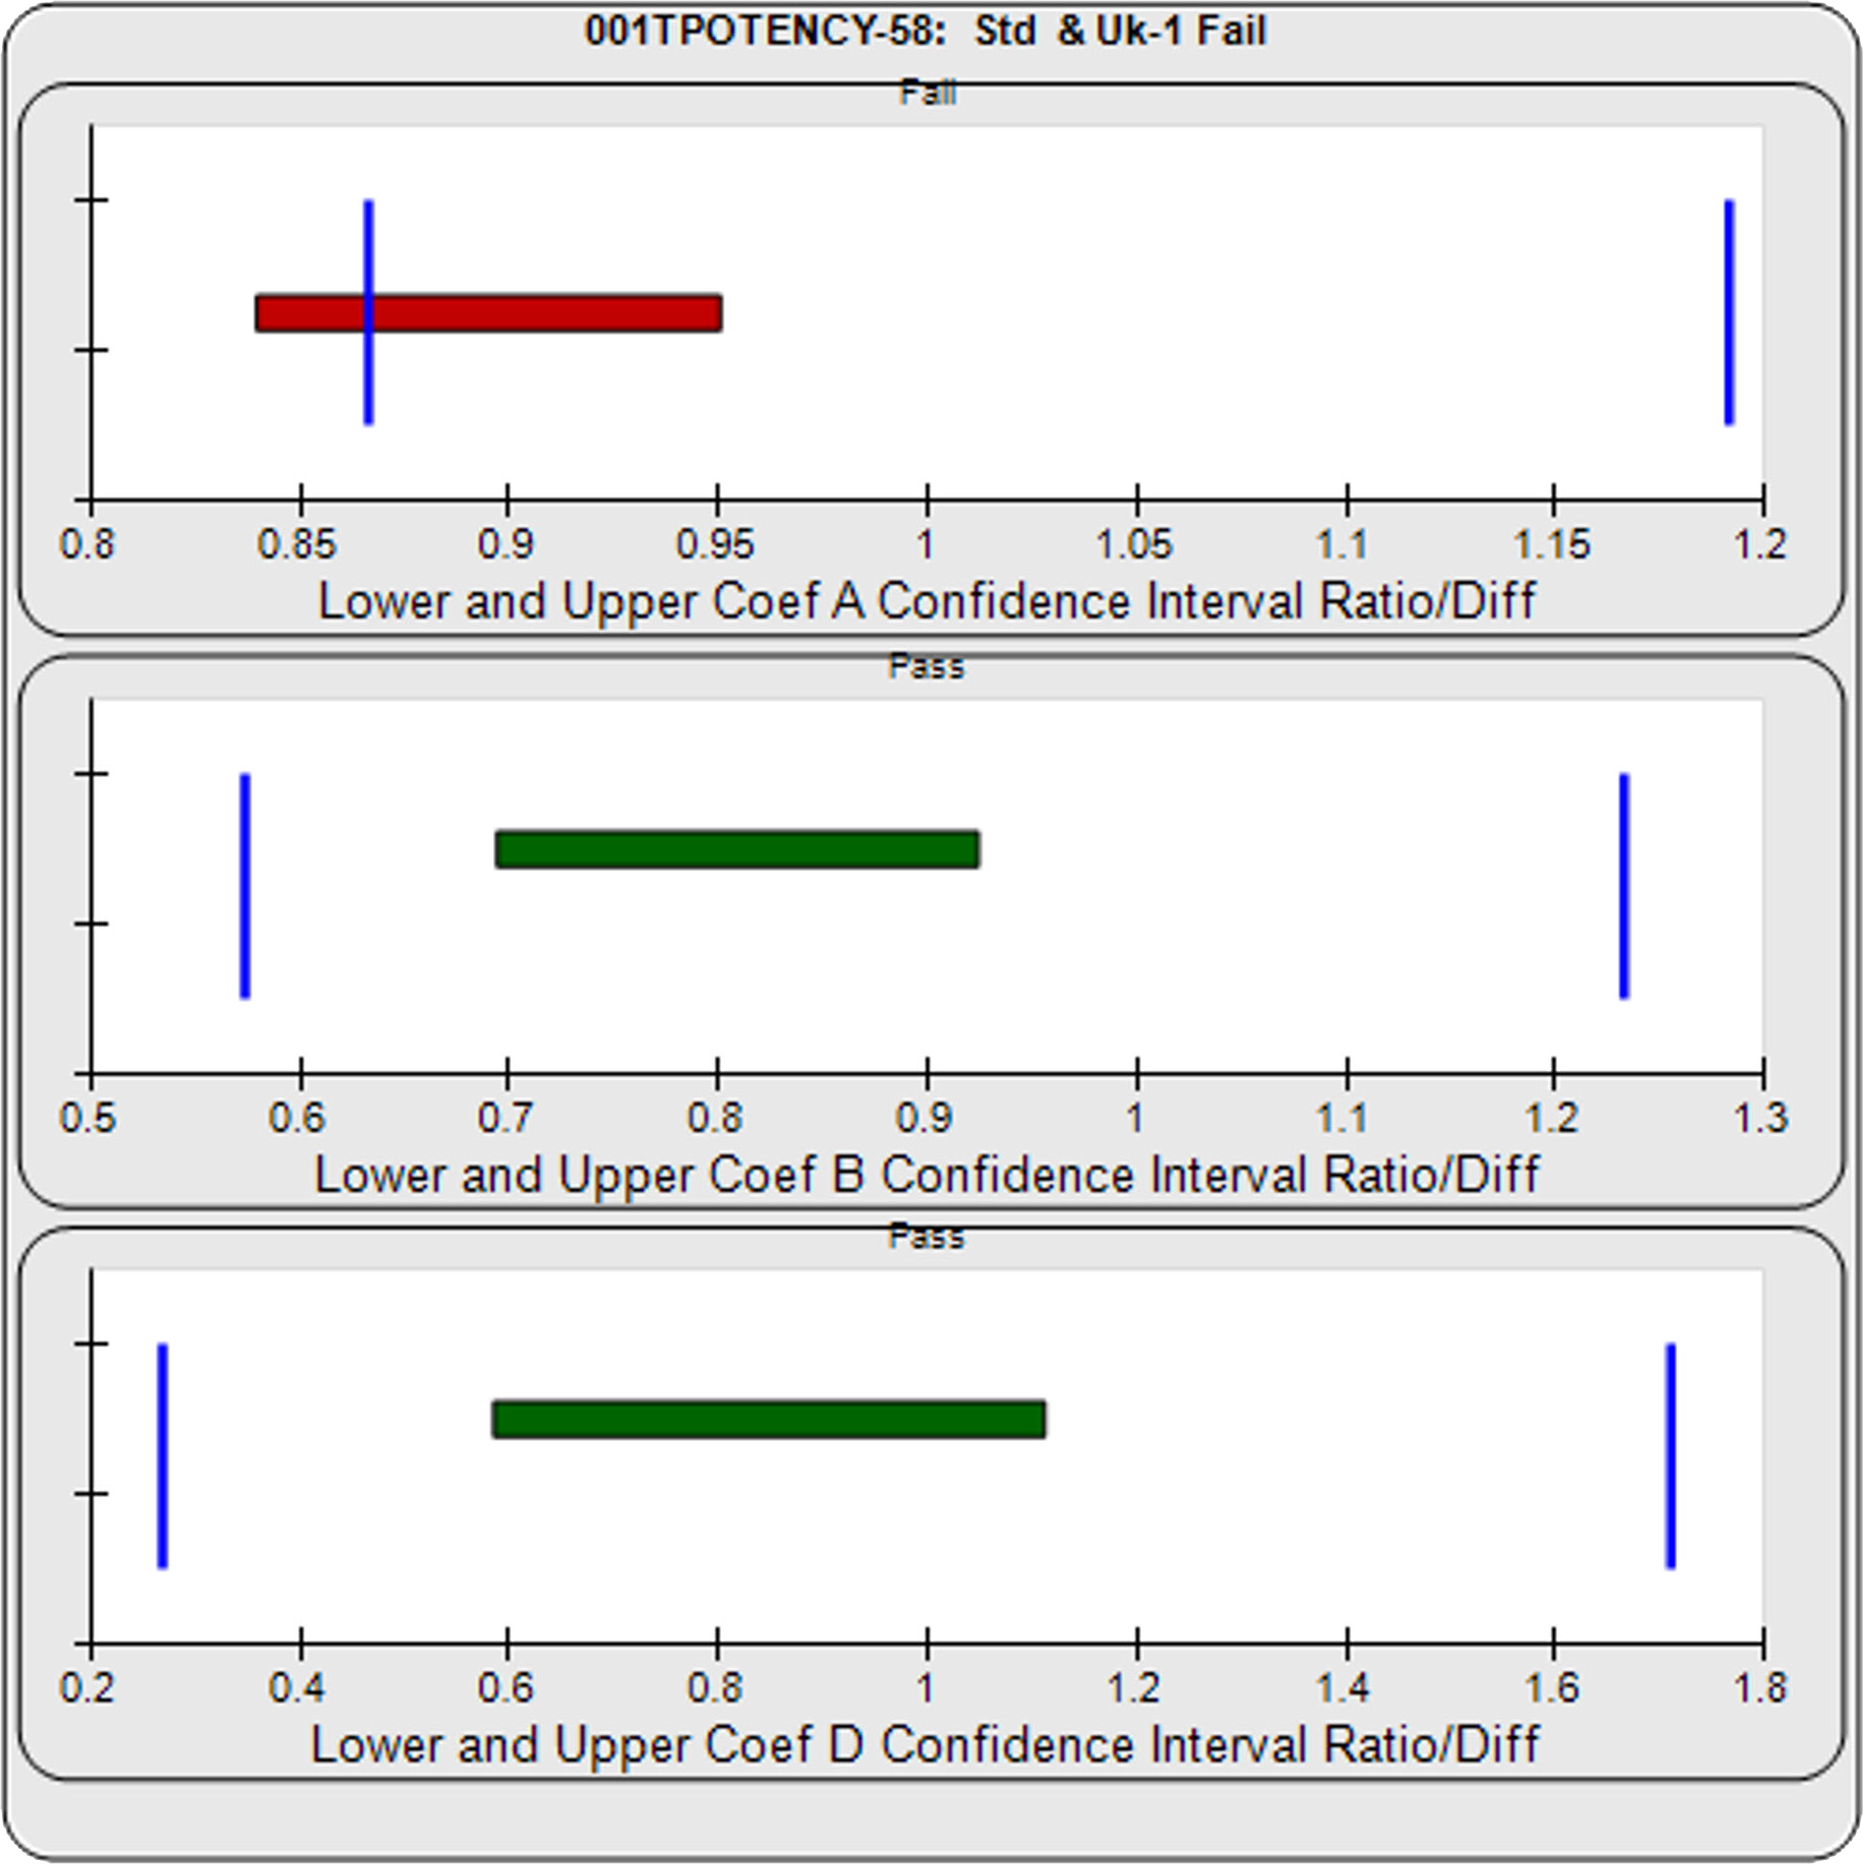
Parallelism Determination
The deltas of the lower and upper confidence interval limits are computed as either ratios (this example) or differences of the Unknown / Standard A, B, D coefficients (4PL) or B coefficient (linear regression) of the unconstrained curves. Both the lower and upper deltas of all coefficients must be within their respective goalpost borders to pass.
The Equivalence Chart plots the lower and upper delta values as horizontal bars between blue goalpost borders. Bars are green when inside blue goalpost borders (pass) and red when outside (fail).
In this example, the lower asymptote (D), and slope of the inflection point (B) confidence limit deltas are within their respective goalpost borders and are shown as green. However, the lower confidence limit delta of the upper asymptote (A) is outside its goalpost border and is shown as red. Therefore this test sample fails the parallelism test.
Relative Potency
The relative potency and its confidence limits are determined from curves constrained to the same shape. Since the curves are not parallel, there is no meaningful relative potency between the reference standard and the test sample in this example.
Establish More Manageable Goalpost Boundaries
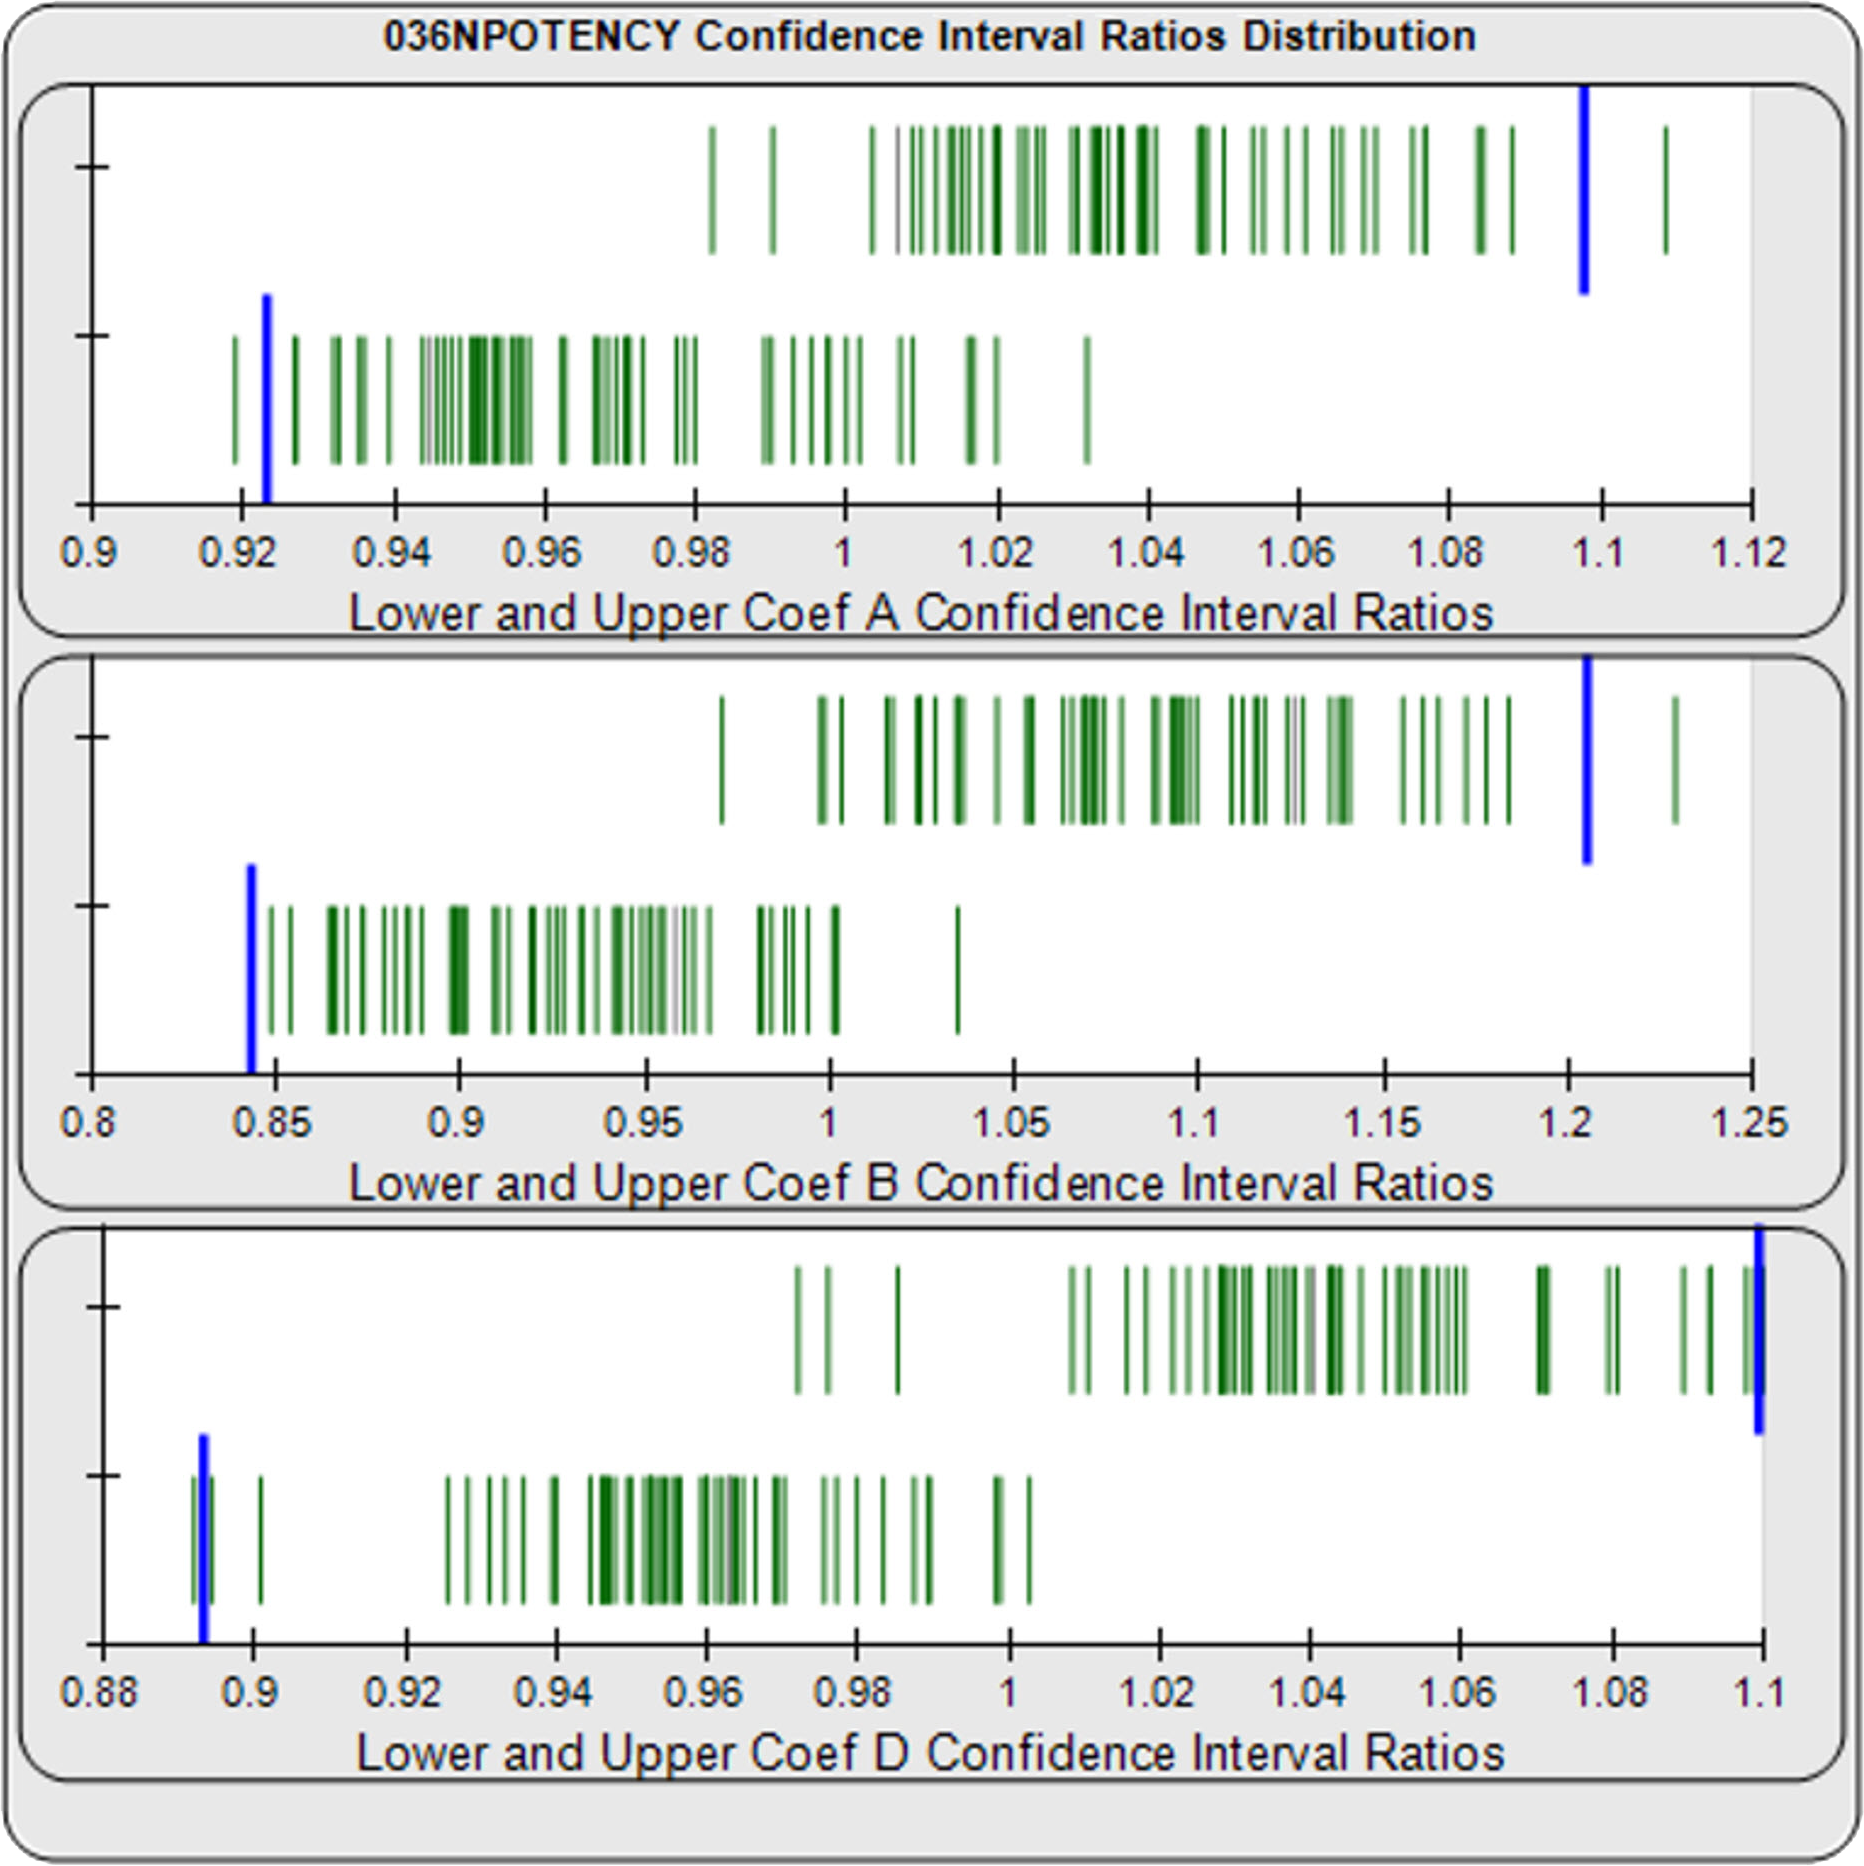
The deltas of the upper (top) and lower (bottom) confidence interval limits for each coefficient of each unknown/standard pair are computed from a pool of your previously run assays. Each delta is shown as a green vertical bar. Curves with bad curve fits or nonparallel unknowns are masked and shown as gray bars.
The confidence interval limit deltas can be either the ratios (this example) or differences of the Unknown / Standard A, B, D coefficients (4PL) or B coefficient (linear regression) of the unconstrained curves.
The upper and lower goalpost borders (blue bars) can be computed as a percentile limit of your pooled assay results or set at goalpost borders established by your laboratory.
The development tools in STATLIA MATRIX can help you determine optimal dilution doses and other factors to make your potency test more stable and precise.
Modify Data Reduction Settings to Address Any Potency Assay Setup Requirement
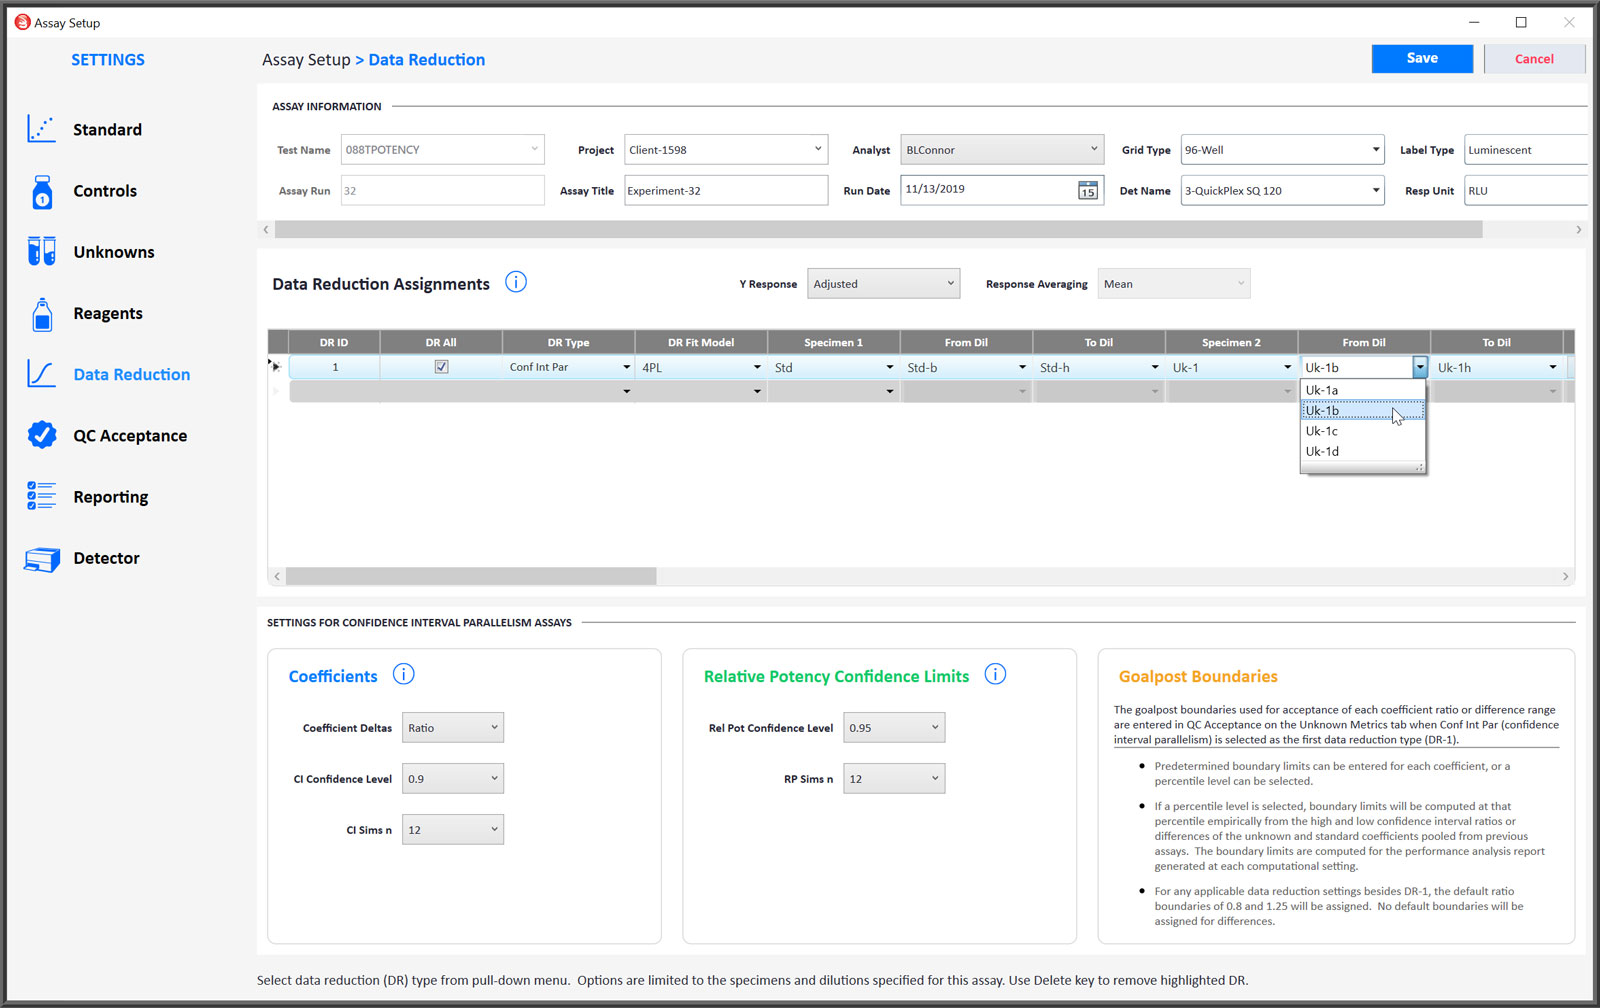
- You can select either the 4PL or linear weighted regression curve fitting for Confidence Interval Parallelism (Equivalence Method) assays.
- End point hooks can be masked from the regression curve or line by starting or ending the dilution series at different points.
- Check DR All to apply the same data reduction settings to all control and unknown dilution curves that have enough dilutions for the regression.
- You can compute the ratio or the differences of the coefficient confidence interval limit deltas between the two specimens.
- The settings for computing the confidence interval limits of the coefficients can be adjusted.
- The settings for computing the confidence limits for the relative potency can be adjusted.
- Goalpost boundaries can be computed automatically or set by your laboratory.