Set Automated Pass/Fail Criteria for Assays and Unknowns to Match Your SOP
QC Acceptance in STATLIA MATRIX provides a comprehensive method for automated Pass / Fail determinations for assays and unknowns based on your SOP.See your data in STATLIA MATRIX.
The Automated QC Acceptance is Flexible and Comprehensive
STATLIA MATRIX allows you to set comprehensive yet flexible metrics for the Pass/Fail acceptance criteria of each assay and each individual unknown result according to your SOP.
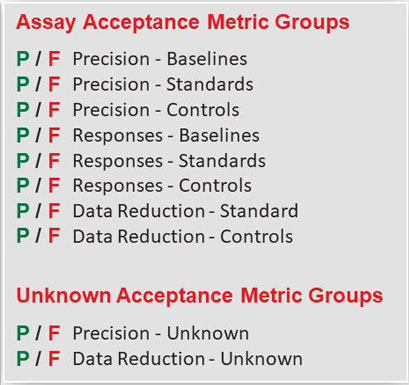
You can include or exclude metrics for the precision, response and data reduction of your baselines, standard and controls for the Pass/Fail acceptance criteria of your assay. The data reduction metrics are specific for quantitation, potency, or immunogenicity tests.
The precision and data reduction metrics of each unknown are matched to the Pass/Fail acceptance criteria you set for your unknowns. The data reduction metrics are specific for quantitation, potency, or immunogenicity tests.
The Pass/Fail determination of each assay and unknown metric you select is based on the acceptance criteria you enter from your SOP.
Setting Your QC Acceptance Criteria is as Easy as 1-2-3
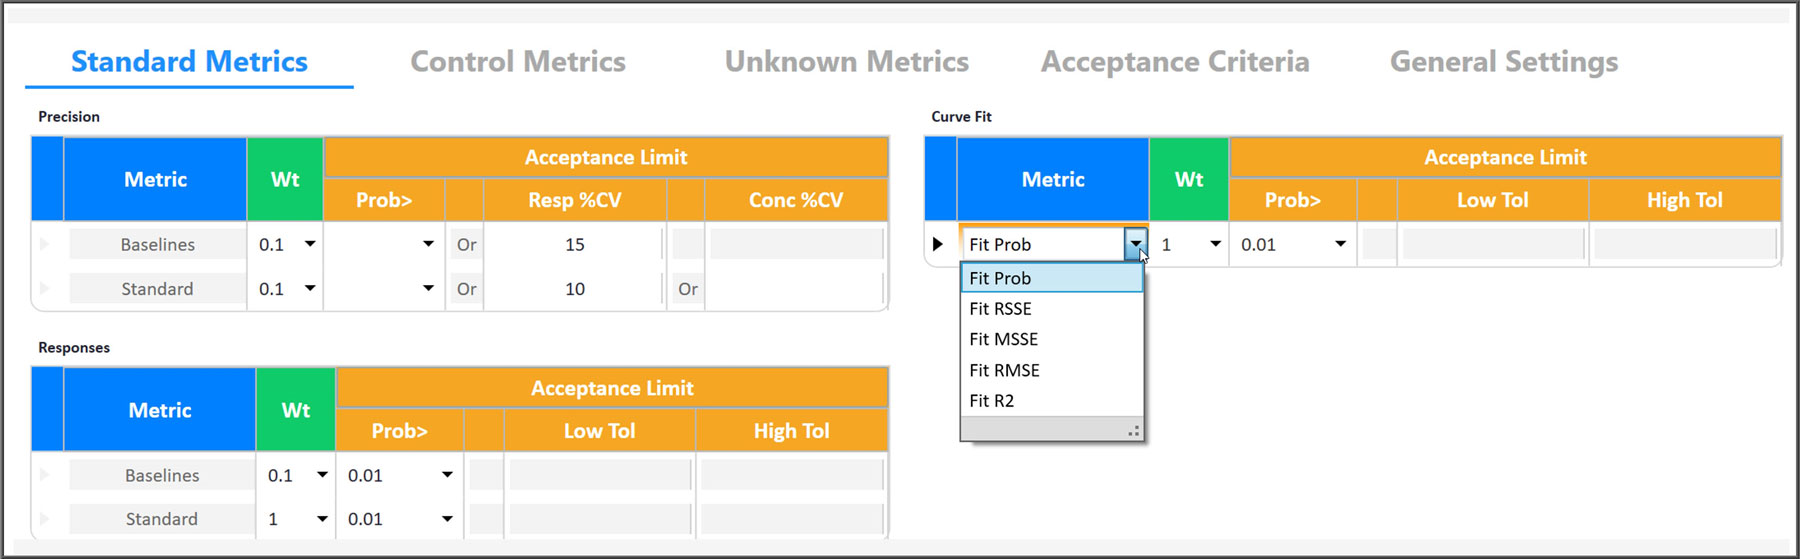
| 1. | Select the metrics you want included from the Standard Metrics, Control Metrics, and Unknown Metrics tabs. |
|---|---|
| 2. | Select the desired Weight (level of influence) you want each metric to contribute to the final Pass/Fail determination (a 0 Weight excludes that Metric). |
| 3. | Select the Acceptance Limit for each Metric. A Prob> is a statistical comparison to your pooled previously run assays. A Low Tol / High Tol is a tolerance range you enter that is established by your laboratory or computed by STATLIA MATRIX. |
Separate Unknown Pass/Fail Metrics For Each Testing Technology
The Pass/Fail for each unknown is determined from the selected precision and data reduction metrics for the unknowns in that test. The data reduction metric options for the unknowns are specific for each testing technology.
Quantitation
- Concentration Range or Concentration Error
Potency (Equivalence Method, Chi-Square Method, F Test)
- Unknown Dilution Curve Fit
- Parallelism
- Relative Potency or Relative Potency Confidence Limit Ratio
Immunogenicity (Tier 1 or Tier 2)
- Cut Point Ratio (Tier 1) or %Inhibition (Tier 2)
Immunogenicity (Tier 3)
- Unknown Dilution Curve Fit
- Cut Point Ratio Titer or Estimated Dose
Assay Acceptance…at a Glance

Standard Response Limits

Control Concentrations and Responses

Control Results Trending

In addition to the metrics and Pass/Fail acceptance criteria, STATLIA MATRIX provides informative graphs to show you “at a glance” if the assay is acceptable. The graph on the left shows the standard responses (red dots) compared to response limits (green region) determined from your previously run assays. The graph in the center shows the control concentrations and responses with their acceptance ranges (green bars) entered by your laboratory or determined by the software from your previously run assays. The trending graph on the right shows the results from the last 30 assays for each control with the 95% confidence limits of the results plotted as horizontal lines. With each control included on the same graph, it makes it easier to see the different sections of the standard curve concentrations each control monitors.
Sample Replicate Outliers Automatically Masked
- Outliers are identified automatically and can be masked from all computations.
- Individual precision outliers from a dilution (minimum 3 replicates) are identified using the Grubb’s test.
- Individual residual outliers off a dilution curve are identified using a residual probability test.
- Outlier thresholds for all outliers identified by the software can be set by your laboratory.