Assay Development
Starting with your first assay, STATLIA MATRIX provides important tools to help you develop and then run your quantitation, potency bioassays, and immunogenicity tests.See your data in STATLIA MATRIX.
Start Collecting Important Information From Your First Assay
The informative graphs and tables start with your first assay. STATLIA MATRIX tracks important metrics such as optimal dilution doses, usable dose range, and if there is saturation of the reaction or signal at low and high dilutions.
When you are developing or modifying a test protocol, STATLIA MATRIX uses the data in the program’s assay database to compare the effects of protocol changes to previous protocols so you can better evaluate those changes.
Reports are generated automatically that include graphs, metrics, ranges, acceptance limits, and more as you develop your test method. All development changes to test assays are tracked and saved.
With STATLIA MATRIX, you can see at a glance if your test method is ready for processing assays or if it needs further refinement.
As you run your assays, the software will automatically monitor any test behavior shift due to reagent lot changes or protocol differences.

Having An Assay Database Lets You Review the Combined Behavior of Pooled Assays
Track the Behavior of Standard Dilutions Responses
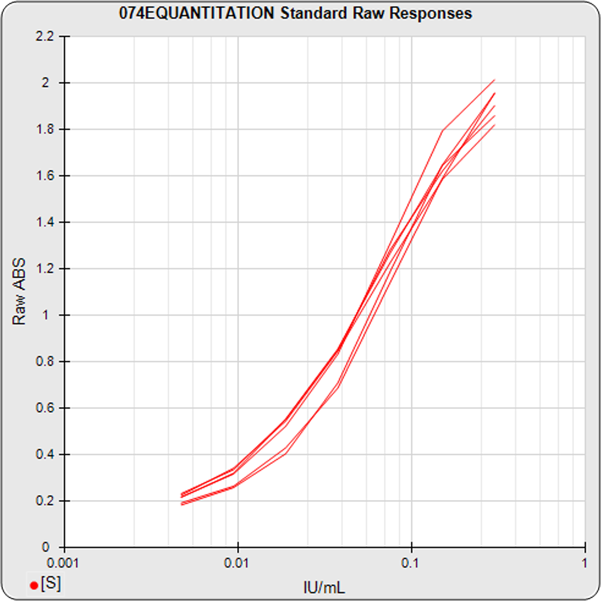
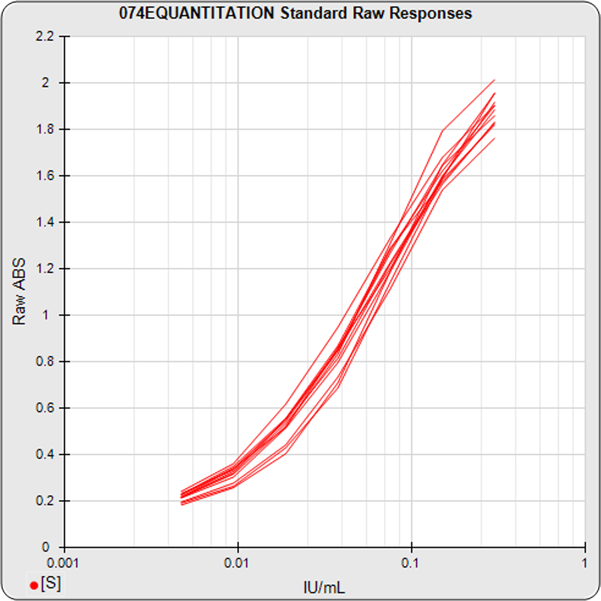
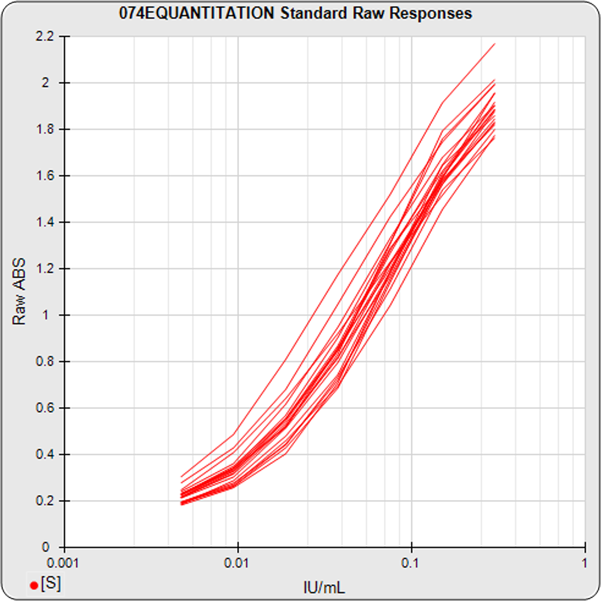
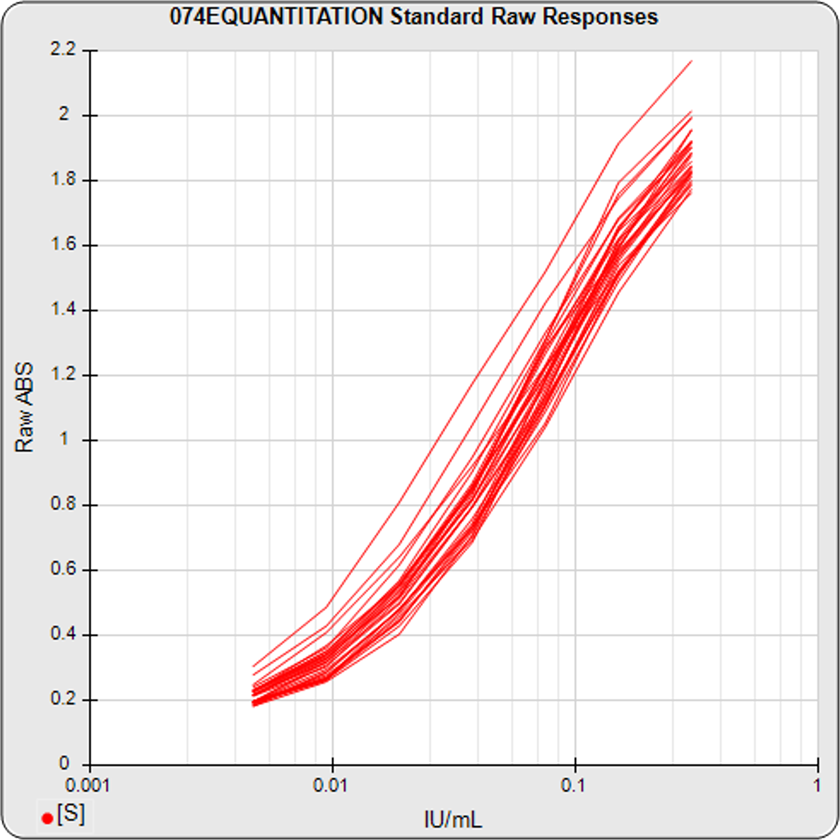
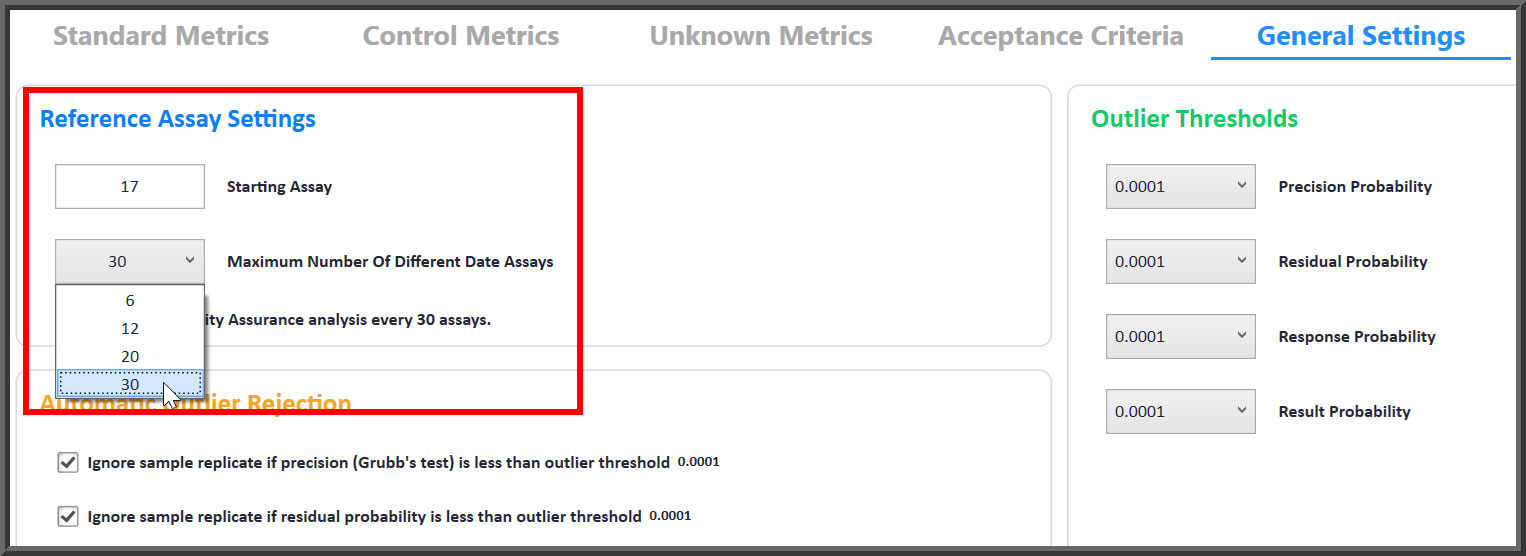
Track standard dilutions responses from pools of 6, 12, 20 and 30 assays.
- Are there non-monotonic regions, or hooks, at either end?
- What is the variation between the dilution responses of multiple assays?
- What is the dose range of dilution responses that has the most reliability?
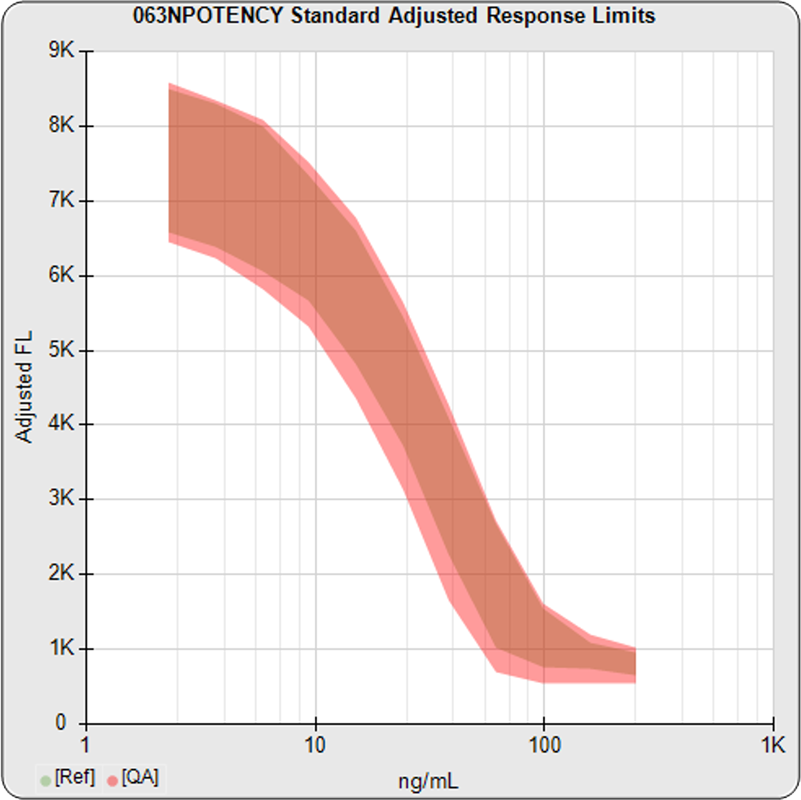
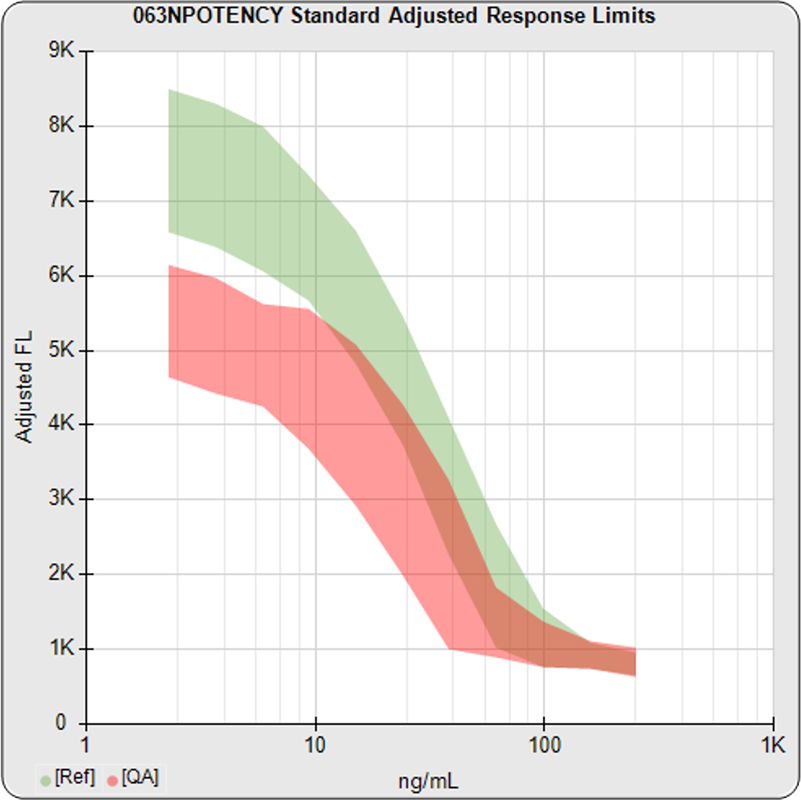
Standard Dilution Response Limits Are Established For You
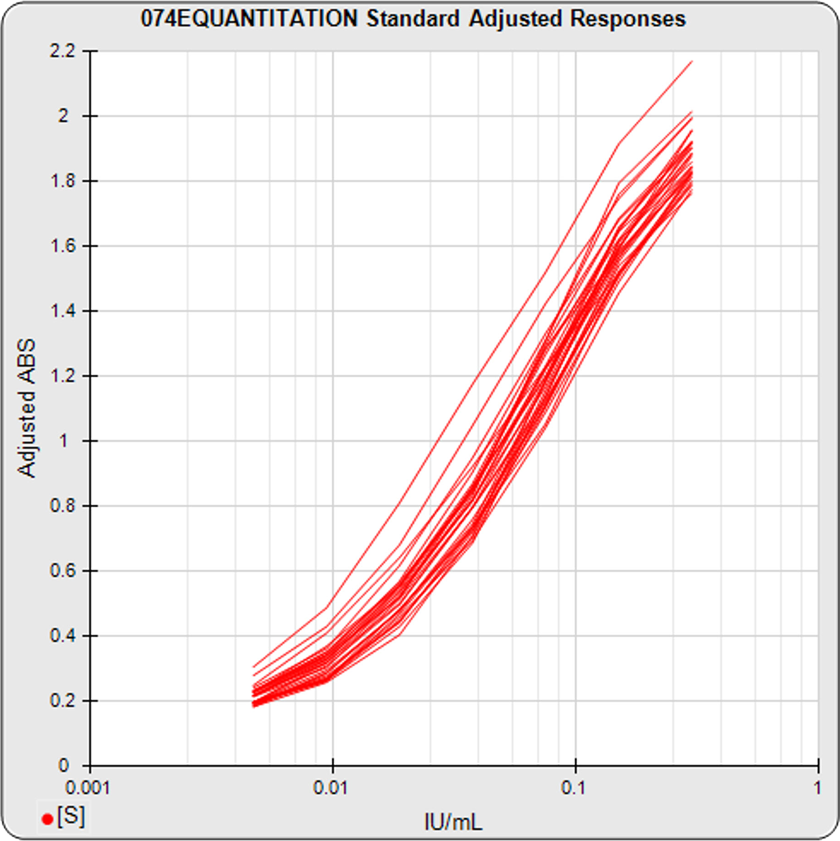
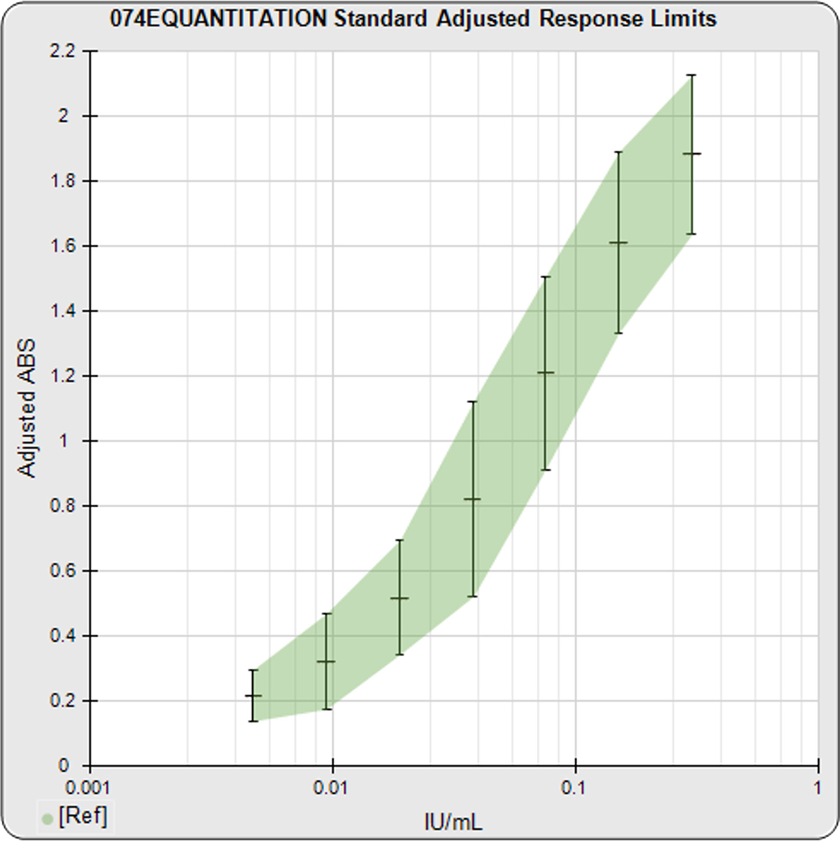
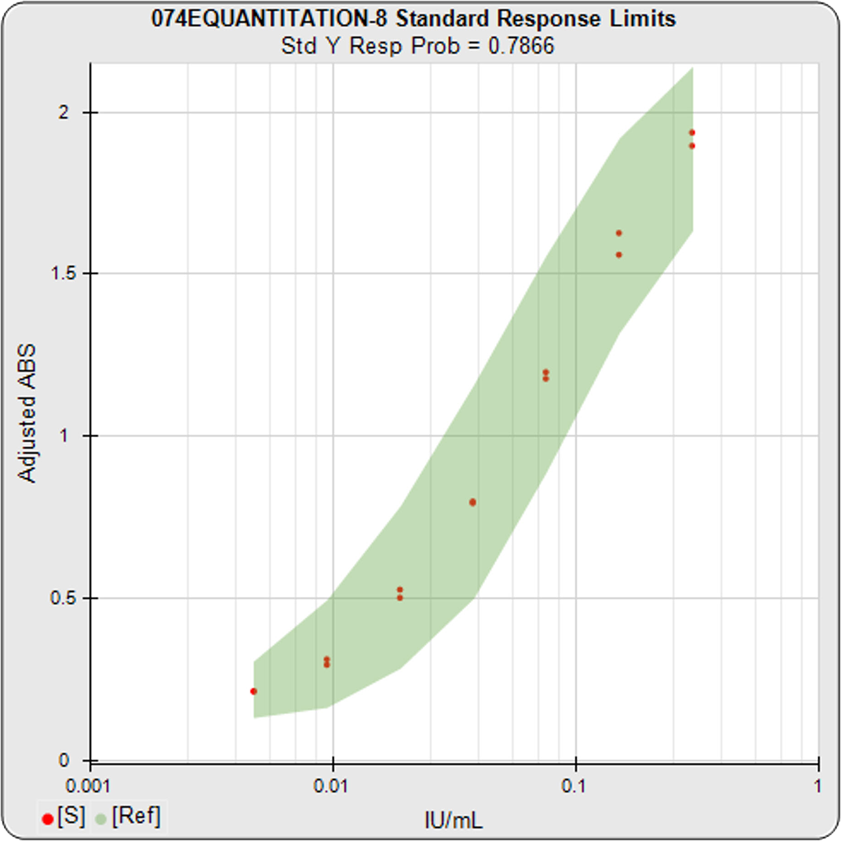
Standard Dilution Response Limits Are Established For You
- The graph on the left shows the responses from each of the standard dilution series in your pooled assays.
- The graph in the middle shows the confidence limits for each standard dilution using the data from your pooled assay responses, after filtering out any outliers.
- The graph on the right shows these limits plotted with the standard dilution responses (red dots) of your assay. From this graph, you can see how the assay is behaving compared to the expected behavior determined by your previous assays.
Distribution of Standard Dilution Responses
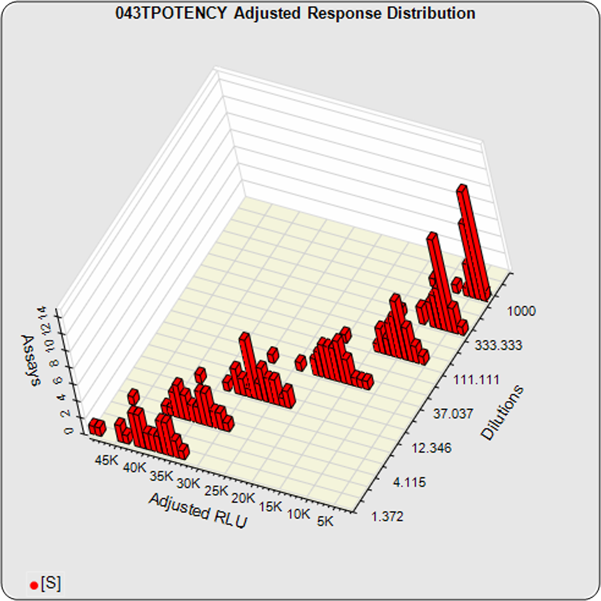
Distribution Of Standard Dilution Responses
- Is the distribution of responses from each dilution a normal (bell shaped curve) distribution?
- Do any end dilutions show no little or no spread in its distribution, indicating reaction or signal saturation at those doses?
- Are there any outlying dilution responses from the pooled responses that warrant further investigation of an assay?
Intra-Assay and Inter-Assay %CVs
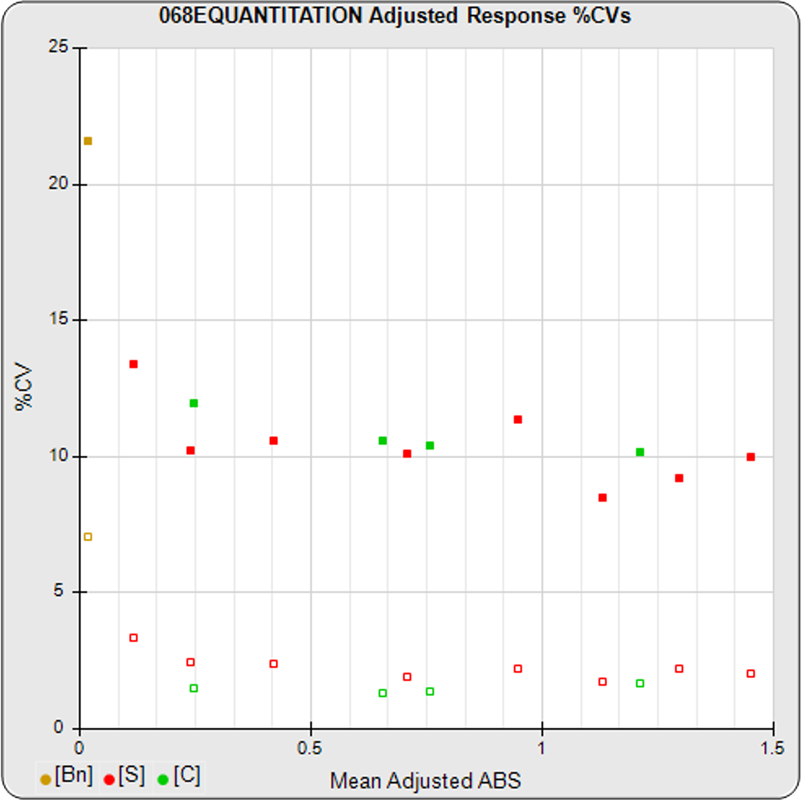
Intra-Assay and Inter-Assay %CVs
- The intra-assay %CV between replicates (open squares) and the inter-assay %CV between assays (filled squares) from the pooled assays of the baseline, standard, and control dilutions should be uniform for all dilutions.
- Higher %CVs at either end indicate the limits of the useful dose response curve. Dilutions with higher response %CVs will be more noise with little contribution from the assay’s biological kinetics, as demonstrated by the blank baseline (Bn) and first standard dilution responses shown in the graph above.
- The control dilutions should have intra-assay and inter-assay %CVs similar to the standard dilutions at those doses. Differences in %CVs indicate matrix differences between the standard and control dilutions.
Standard Dilution Response Residuals²
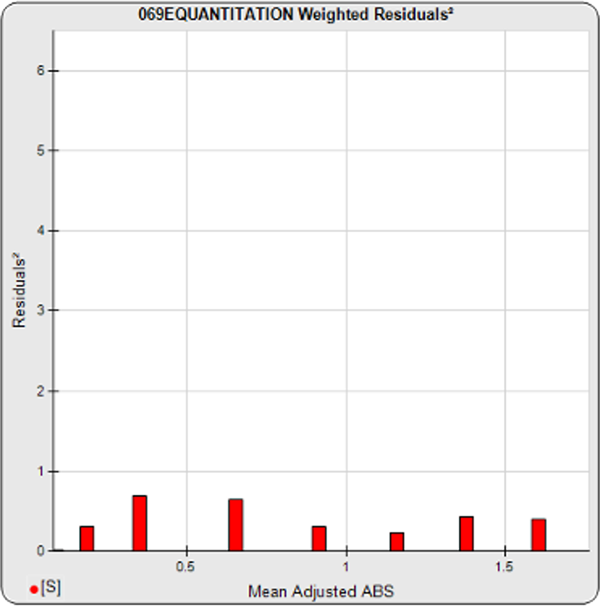
Standard Dilution Response Residuals²
- The individual residuals² (red bars) are the pooled assay averages of the squared differences between the observed and predicted response off the curve of each dilution, divided by its expected variance (weight).
- The sum of these residual² averages should equal the degrees of freedom (number of points – number of curve parameters).
- The distances between adjacent standard dilutions should be relatively uniform.
- There should be no clumping of responses at either end. Clumped responses have higher than average residuals² and worsen the fit and accuracy of the regression curve. Clumped responses at the ends often indicate nonmonotonic hooks.
Distribution Of Weighted Standard Dilution Residuals²
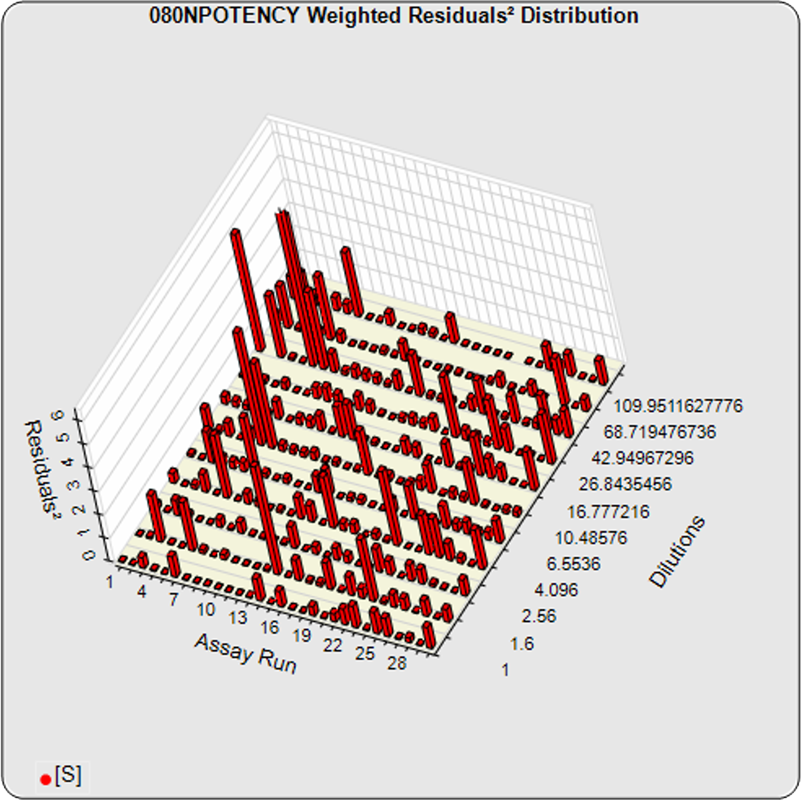
Distribution Of Weighted Standard Dilution Residuals²
- The individual residuals² (red bars) are the squared differences between the observed and predicted response off the curve of each dilution, divided by its expected variance (weight).
- The distribution of these weighted residuals² should be random without a single pattern for one dilution across all of the assays and the opposite behavior for an adjacent dilution.
- The weighted residuals² of individual assay dilutions will reflect the distribution of curve RSSEs of the assays.
Standard Curve Precision Error Profiles
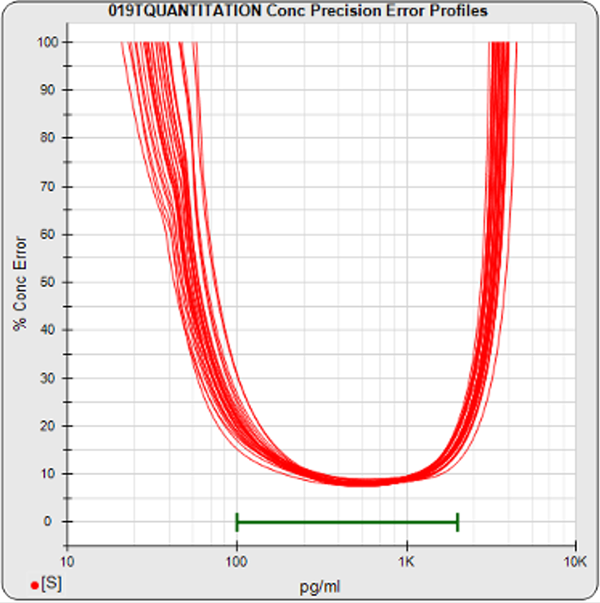
Standard Curve Precision Error Profiles
- STATLIA MATRIX generates precision error profiles (red lines) of the concentration errors of the pooled standard curves, plotted against the desired reportable range (green bar). See the manuscript on the software’s error profile method.
- These plots shows the limits of quantitation at any desired concentration error threshold under the protocol conditions of the pooled assays.
- Precision error limits of quantitation often can be expanded by changing standard dilution doses or other protocol conditions.
- The precision error profiles allow you to gauge the usability of the test protocol against the desired reportable dose range of a quantitation test or effective dose range of a potency test.
Monitor How Your Responses Are Trending
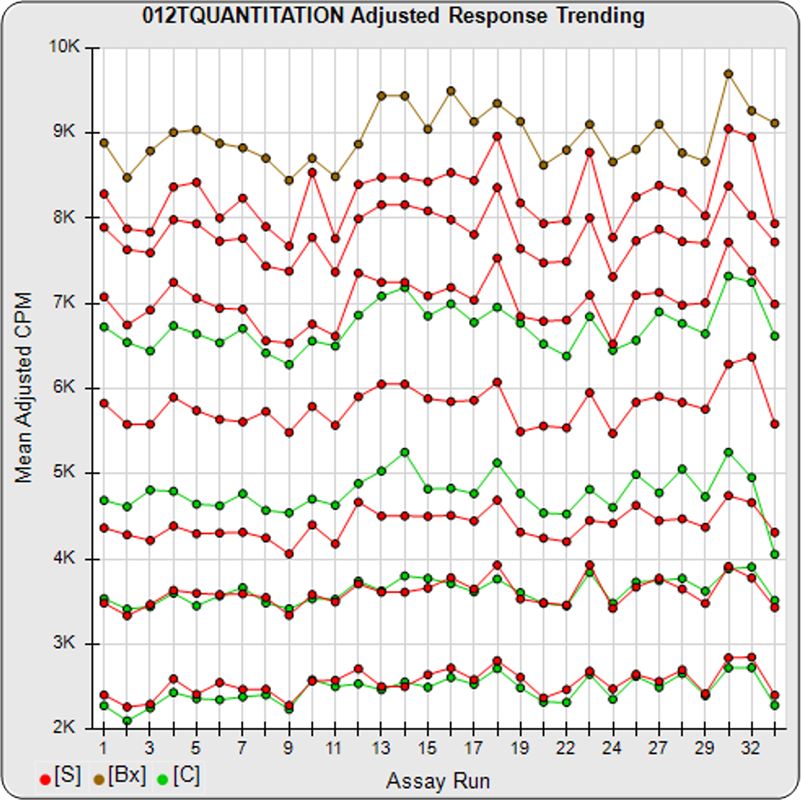
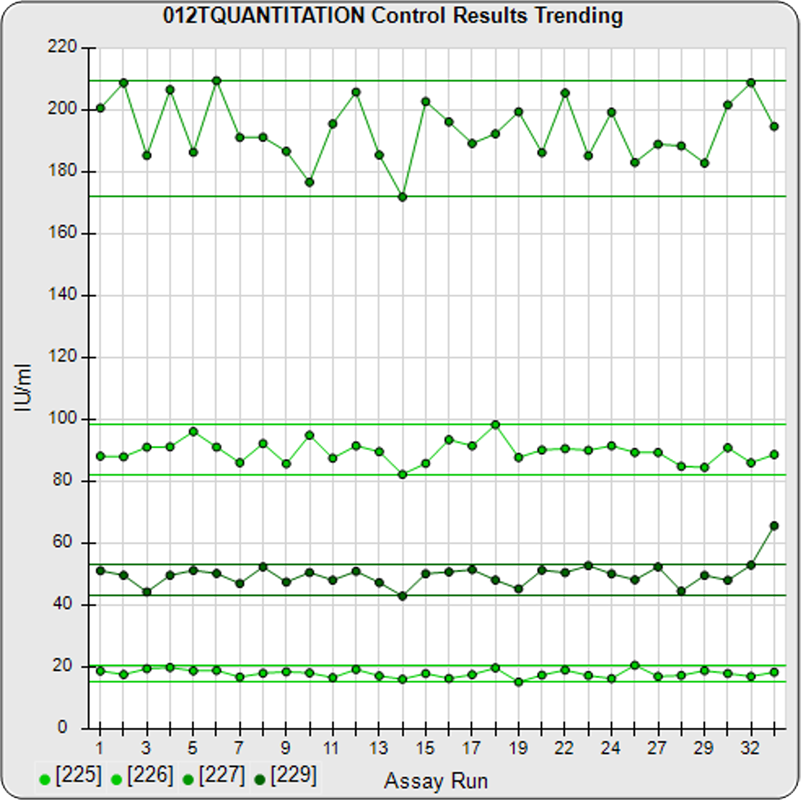
Monitor How Your Data Are Trending Across Assays
Detect Assay Drift Over Time
Detect Assay Drift Over Time
Once Your Assay Protocol Is Set, Let STATLIA MATRIX Establish Your New Performance Metrics
Establish New Ranges And Limits For All Metrics