Intra-Assay and Inter-Assay %CVs
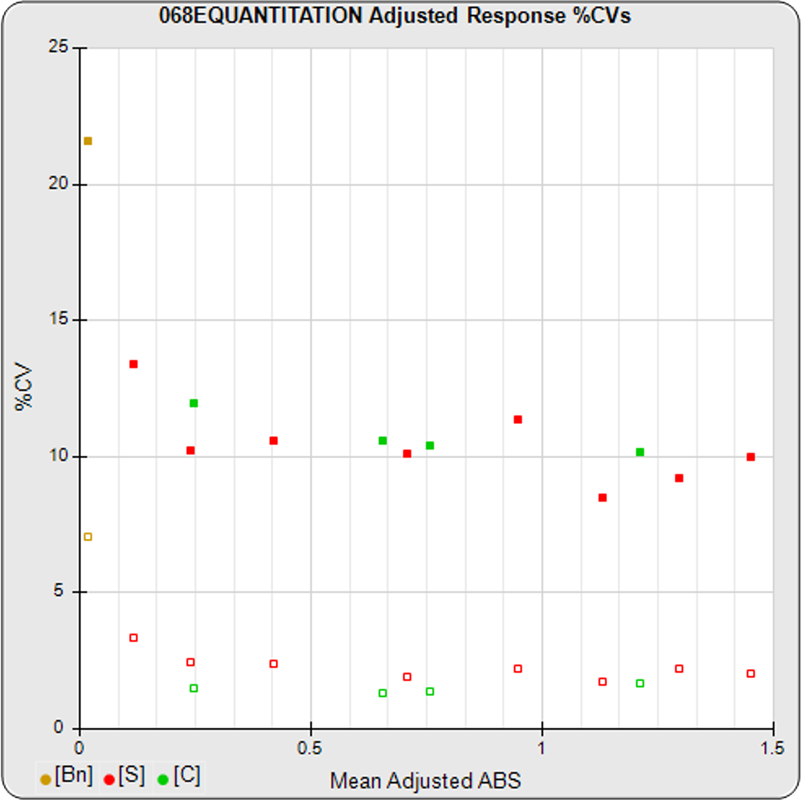
- The intra-assay %CV between replicates (open squares) and the inter-assay %CV between assays (filled squares) from the pooled assays of the baseline, standard, and control dilutions should be uniform for all dilutions.
- Higher %CVs at either end indicate the limits of the useful dose response curve. Dilutions with higher response %CVs will be more noise with little contribution from the assay’s biological kinetics, as demonstrated by the blank baseline (Bn) and first standard dilution responses shown in the graph above.
- The control dilutions should have intra-assay and inter-assay %CVs similar to the standard dilutions at those doses. Differences in %CVs indicate matrix differences between the standard and control dilutions.