91 Relative Potency Test Examples
91 Relative Potency Tests Using RSSEnonpar Method and Equivalence Method for Parallelism Determinations
The potency tests displayed here were collected from laboratories around the world. All test names and other identifying information have been changed. Some of these potency tests were in the development stage, and some were screening assays for test samples containing indistinguishable bioactive material. The graphs are of pools of 12, 20 or 30 assays, each assay having from 1-10 test samples. Precision and residual outliers were automatically masked. Many of the potency issues that are readily apparent in some of these pooled assay views, such as recurring hooks, lack of saturation plateaus, asymmetry, and widely divergent dilution curves, were not obvious when the assays were only viewed individually. These issues, however, are quite evident in the many assay development graphs and tables in STATLIA MATRIX. These tools can be used to optimize dilution doses and other factors to make your potency tests more stable and precise. Examples of this optimization are shown in other case studies on this site (Potency Dilutions 076E and Potency Dilutions 046N). Contact the company for more information about any of these tests. There are four graphs displayed here for each potency test:
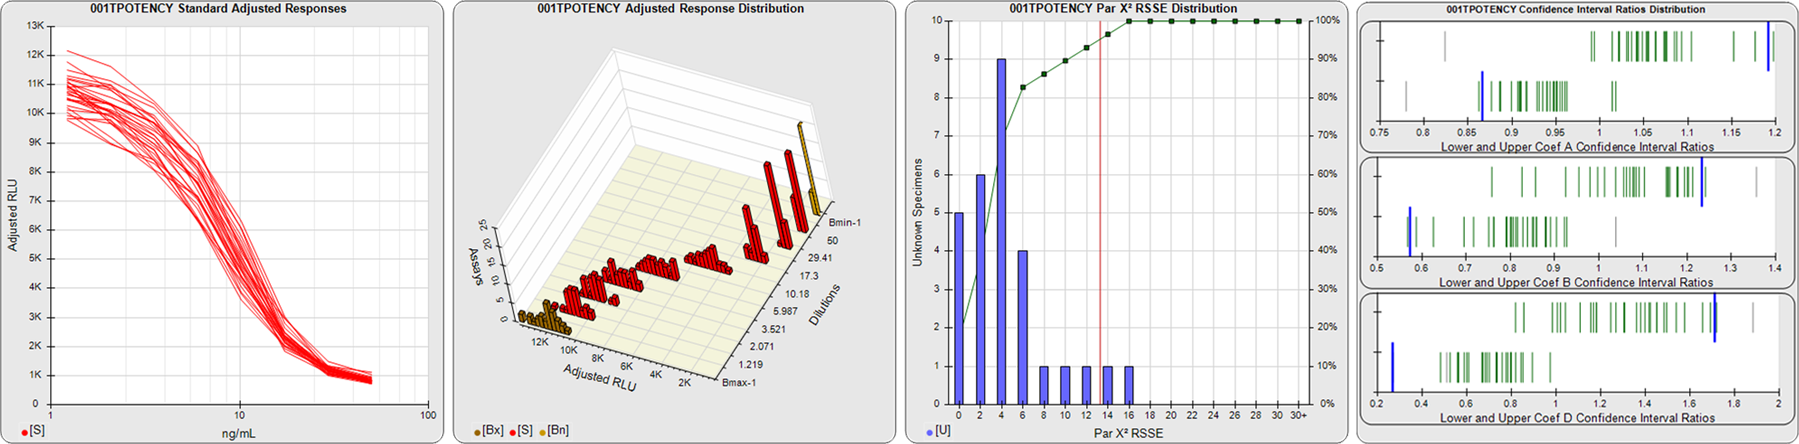
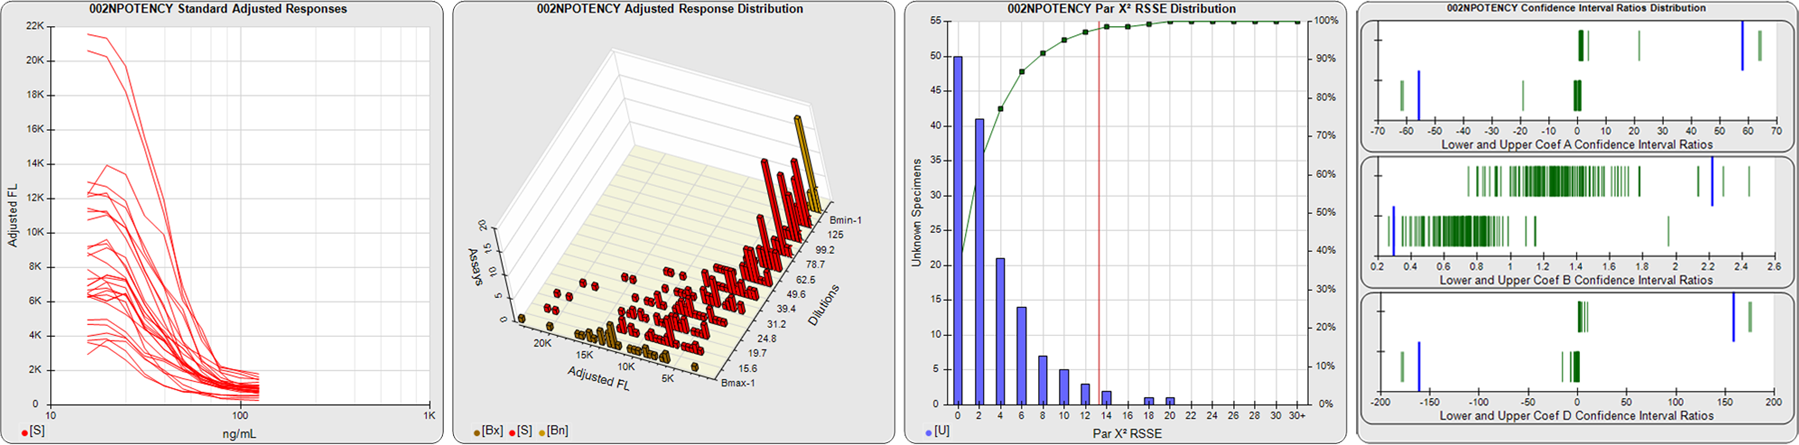
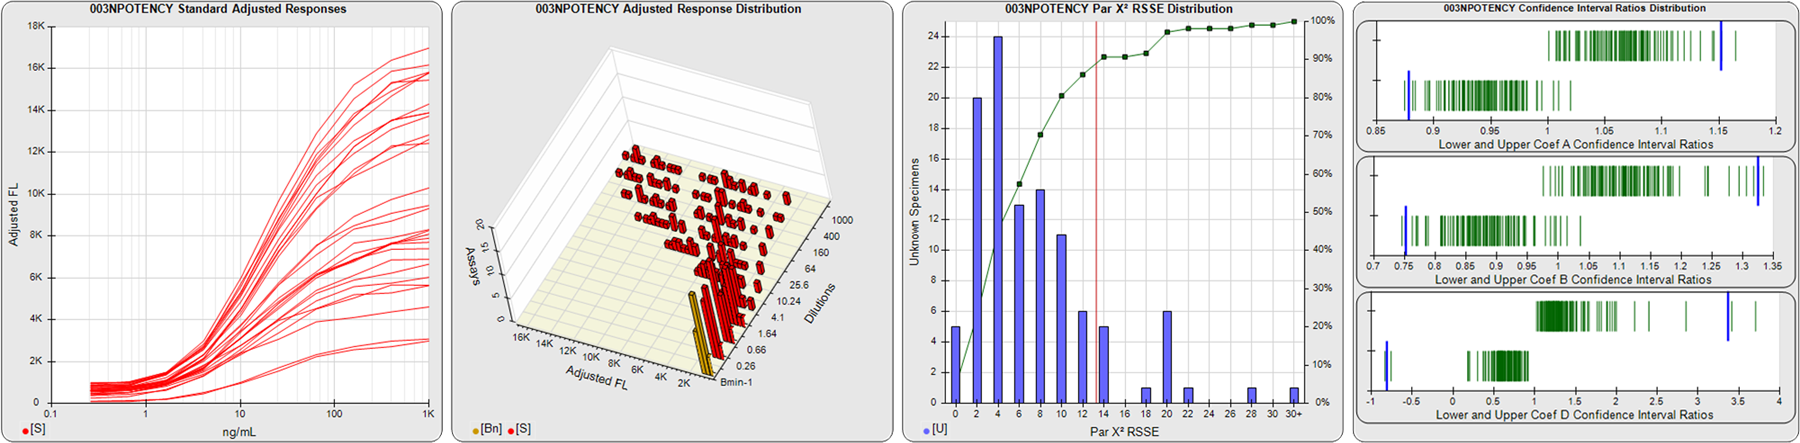
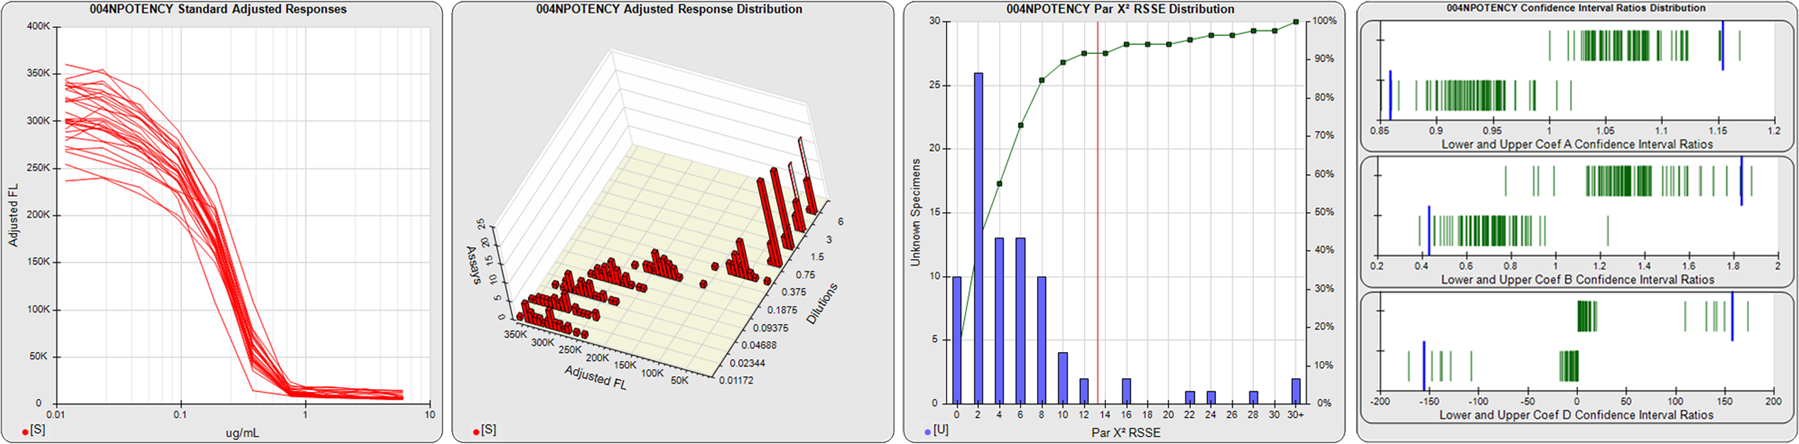
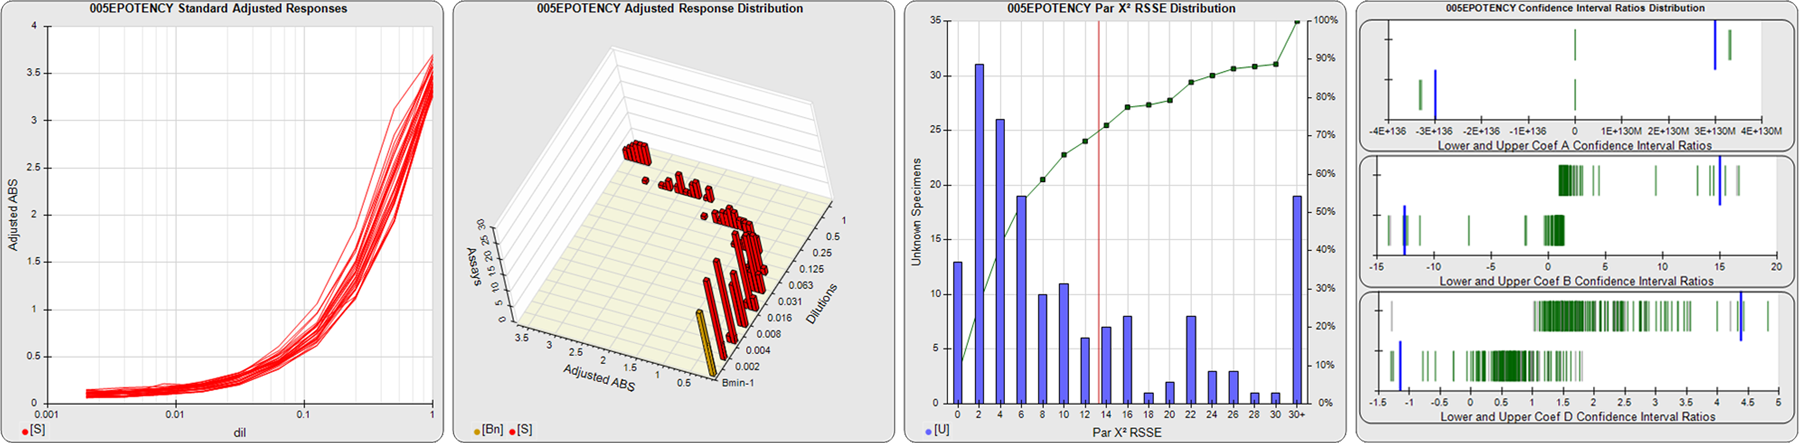
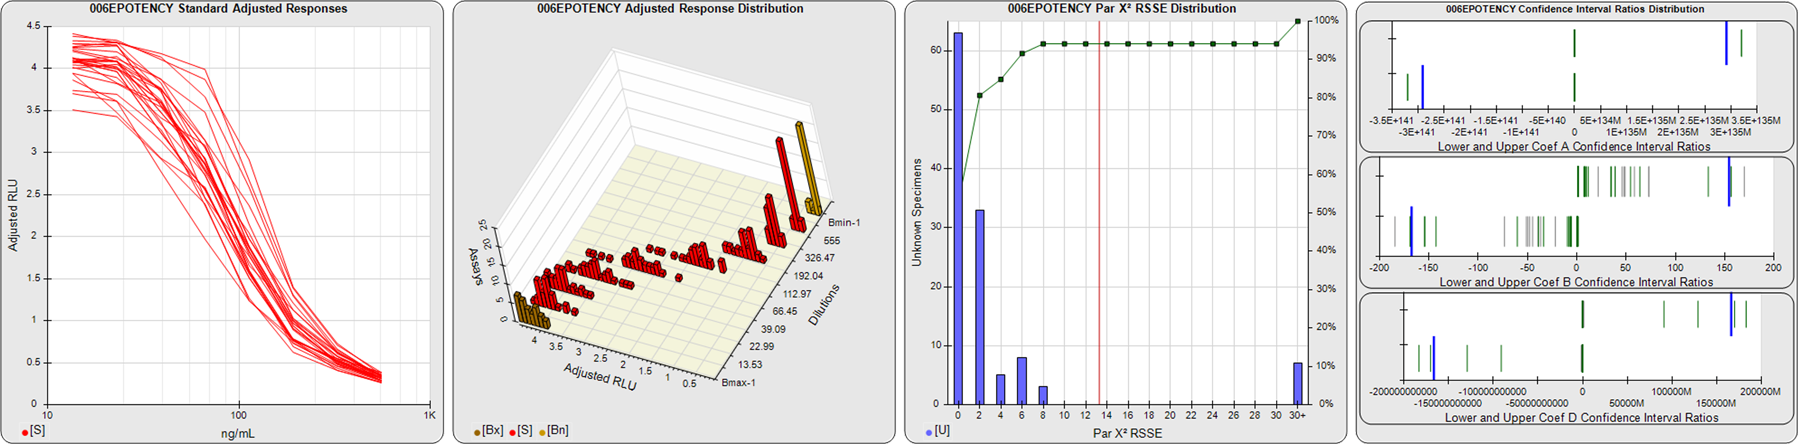
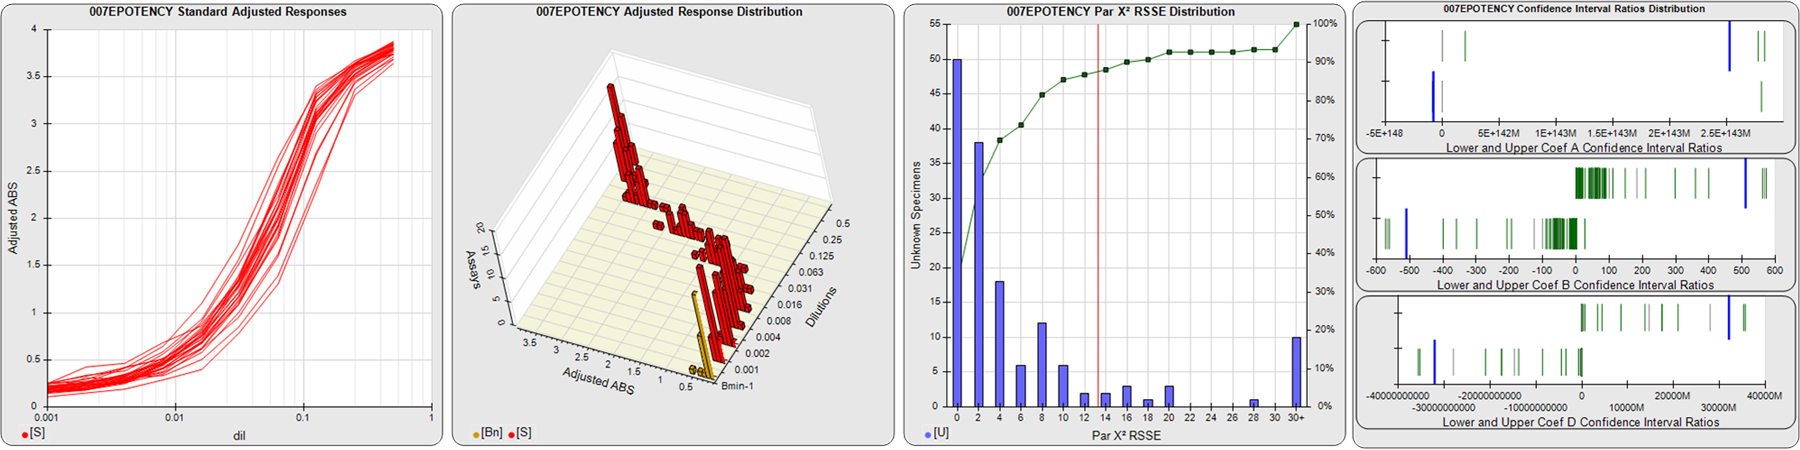
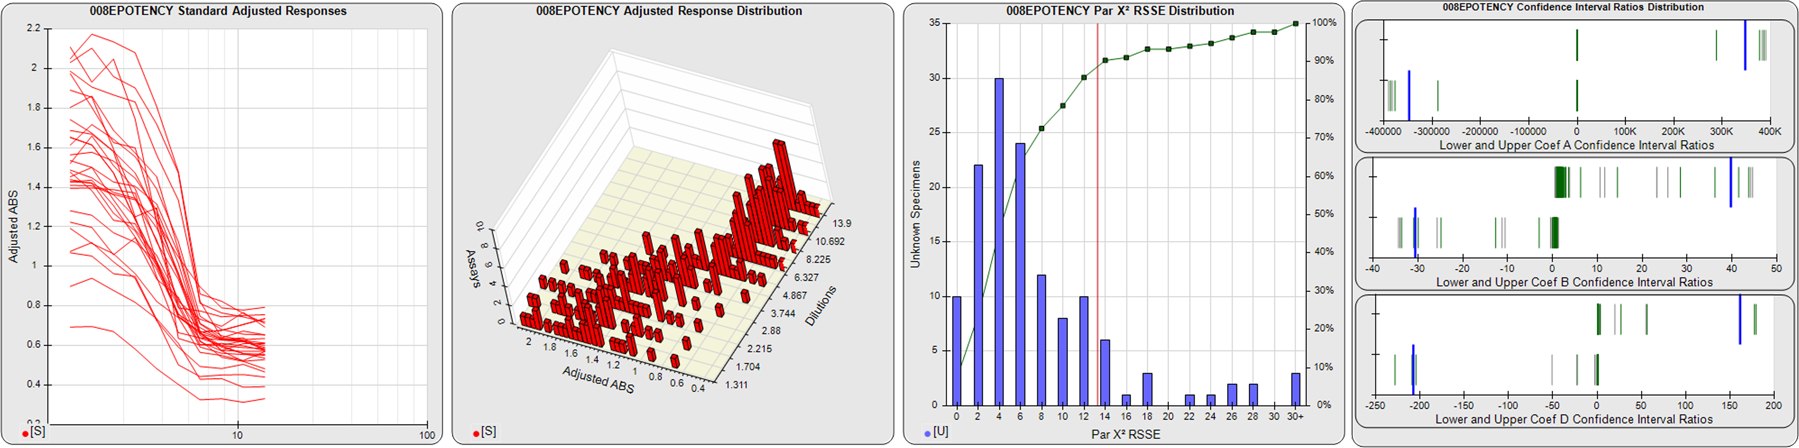
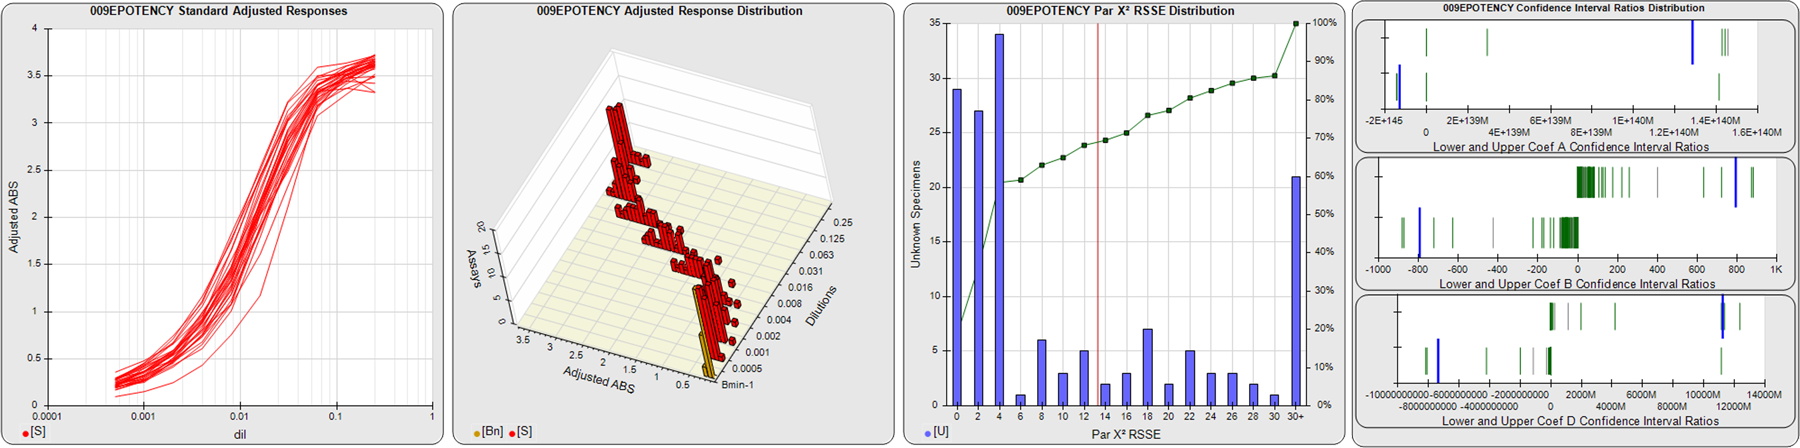
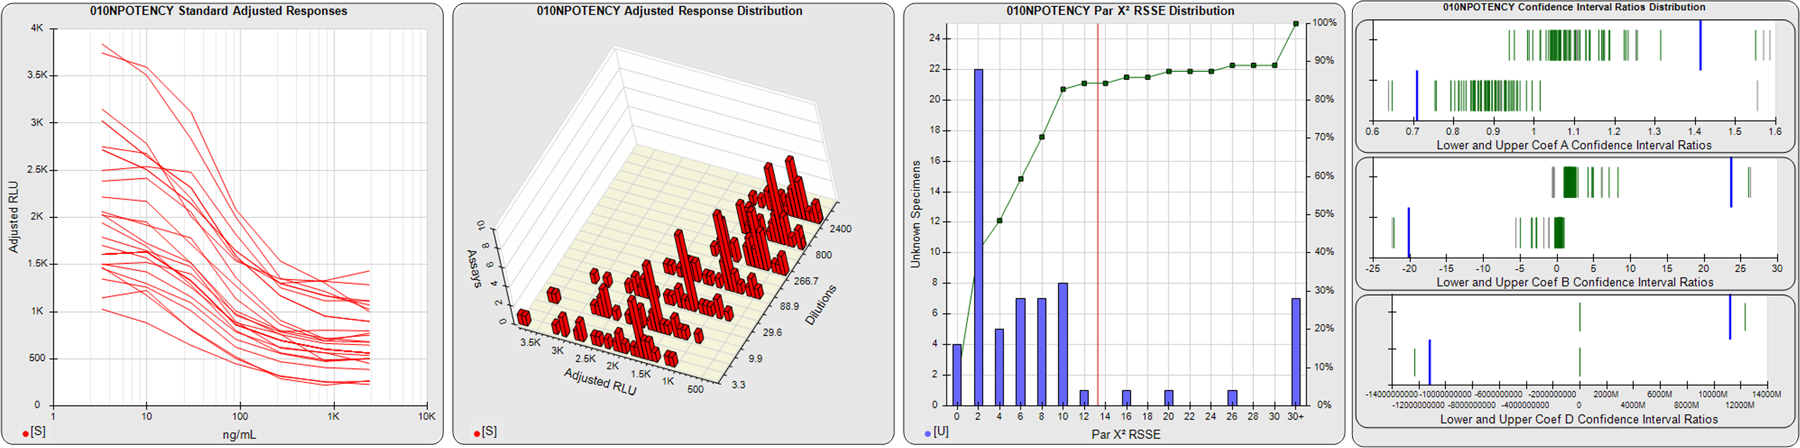
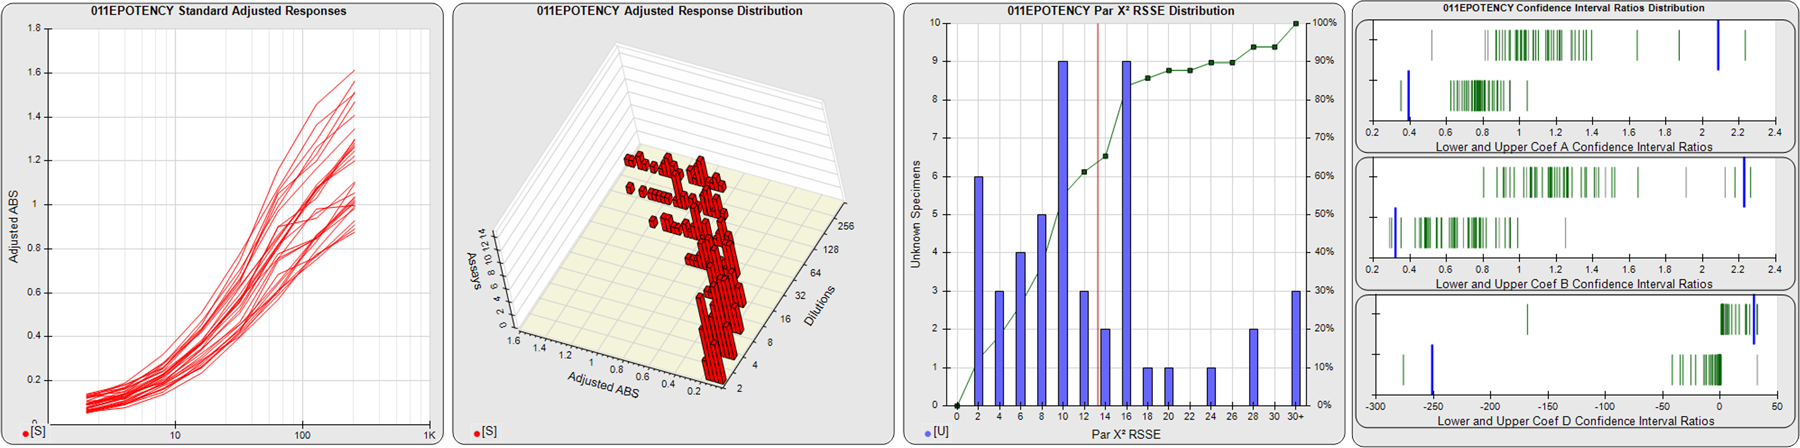
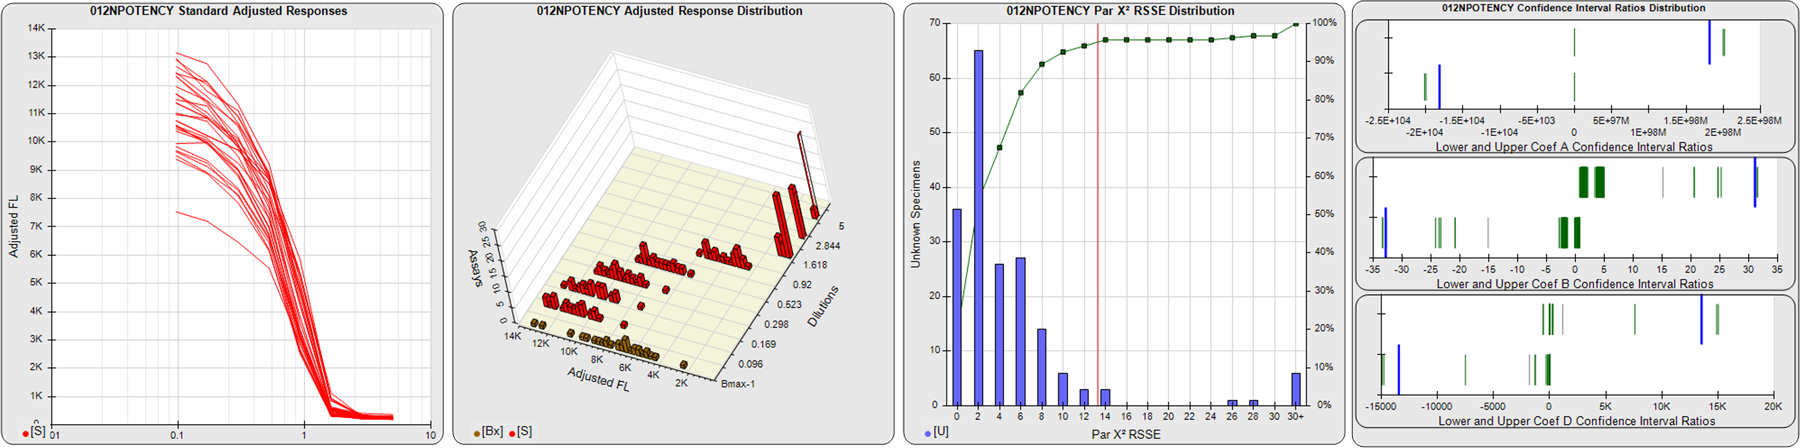
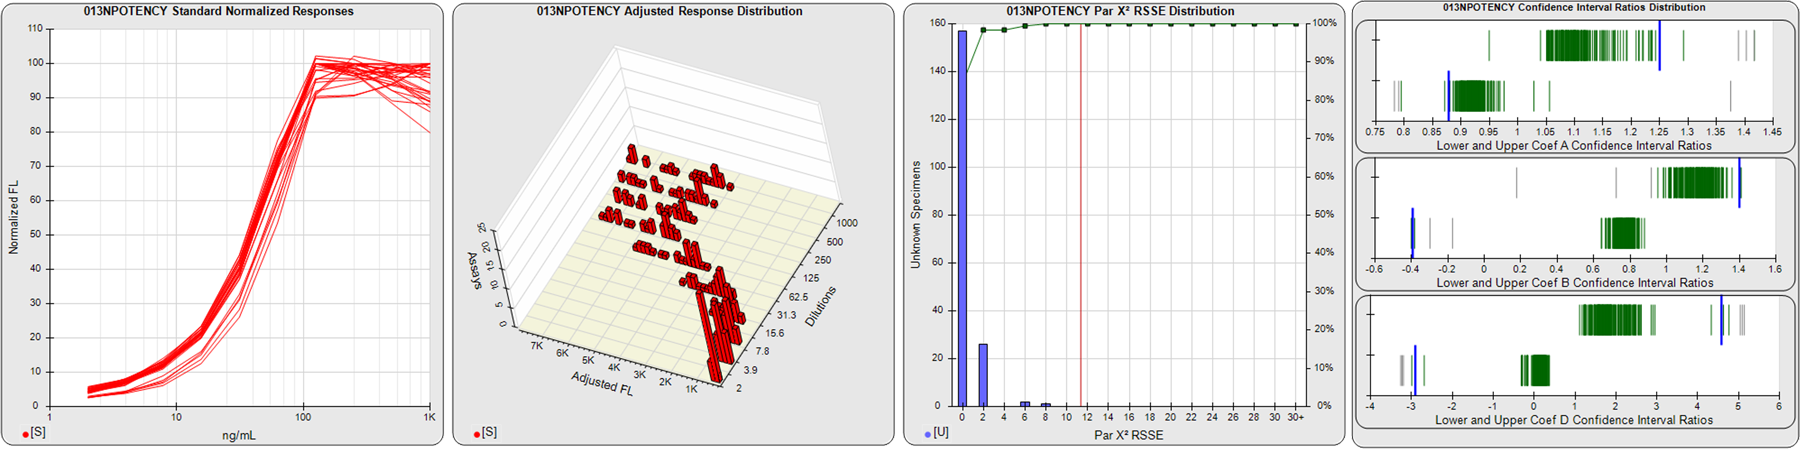
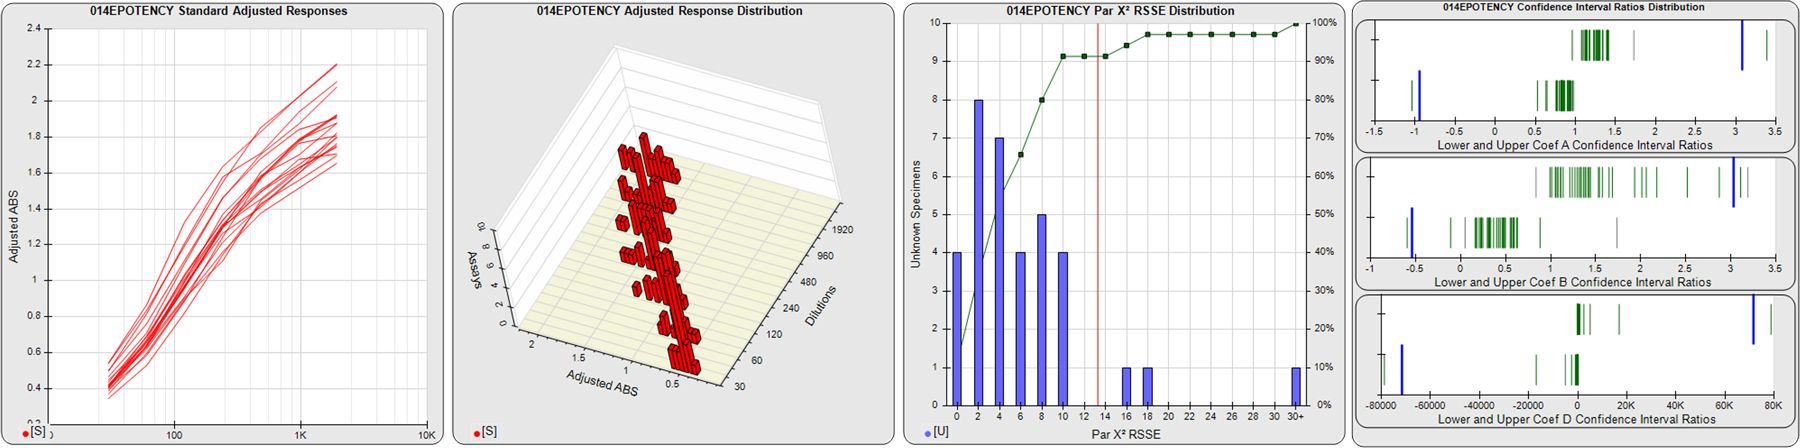
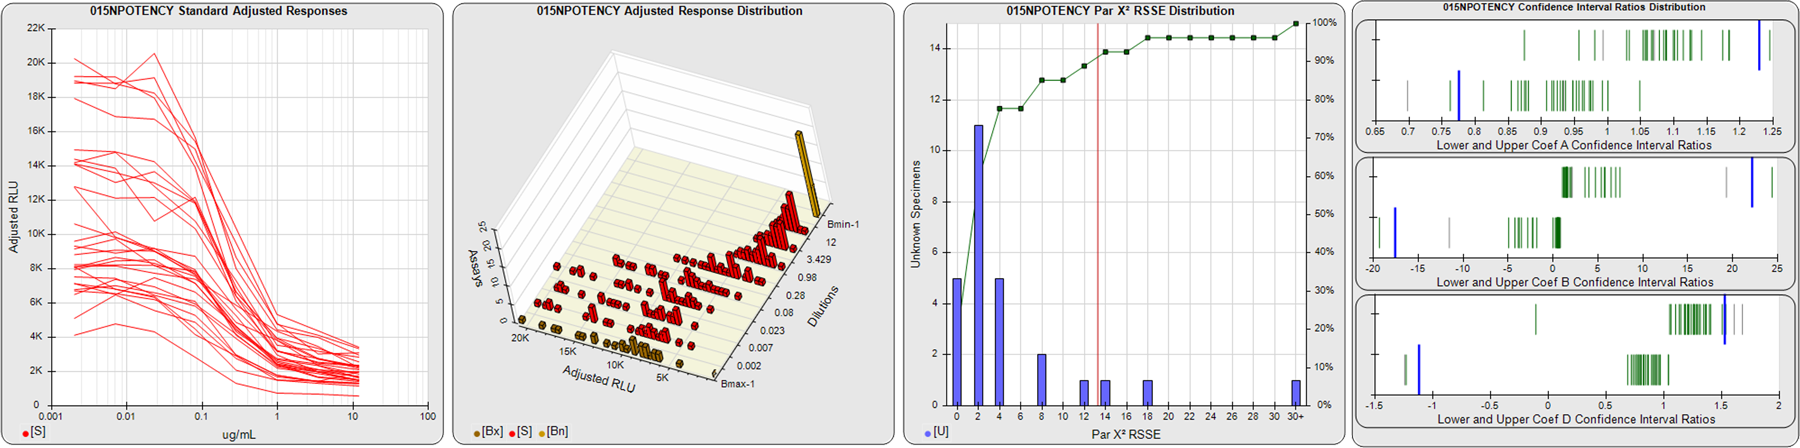
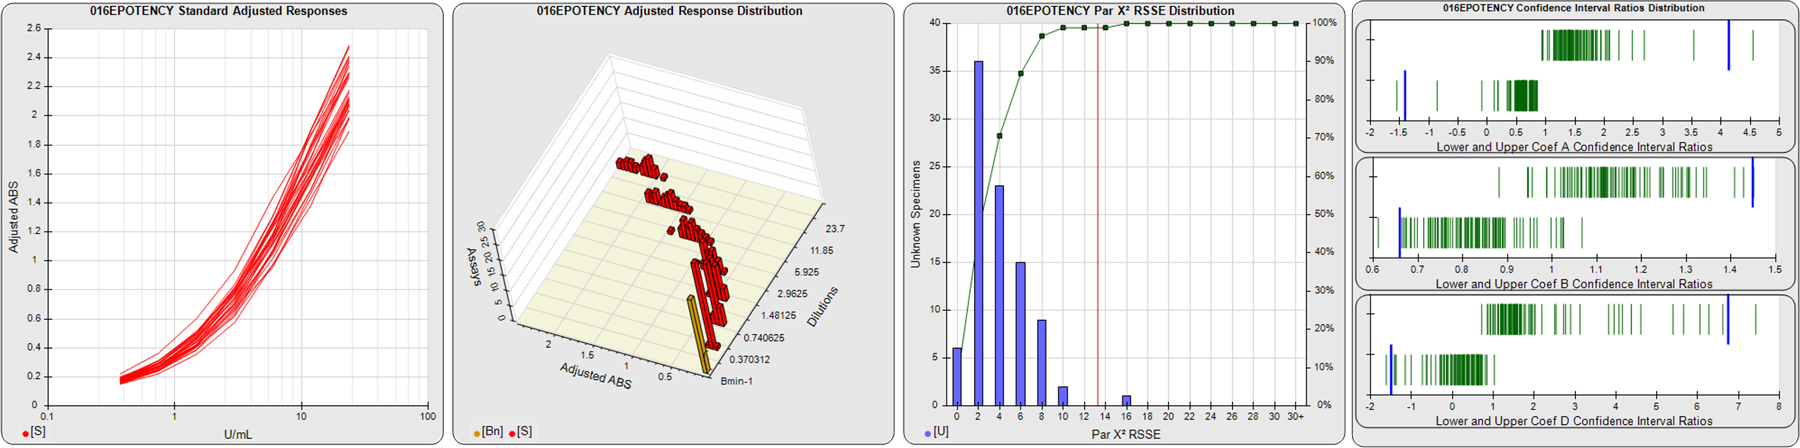
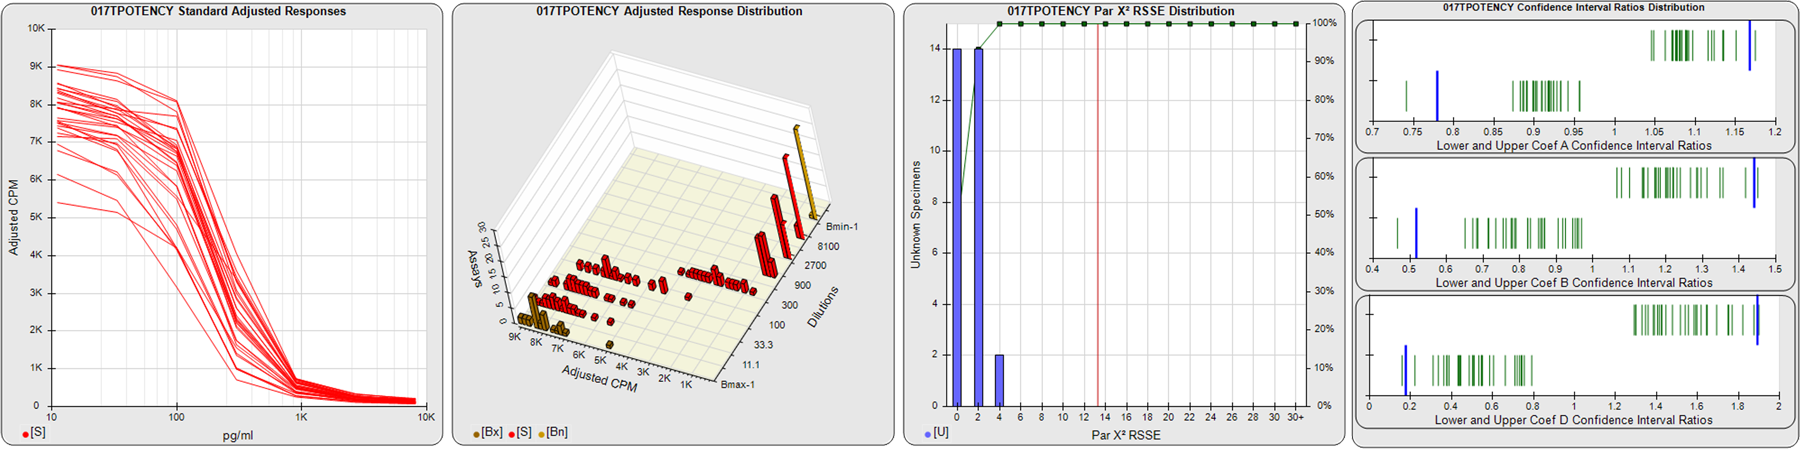
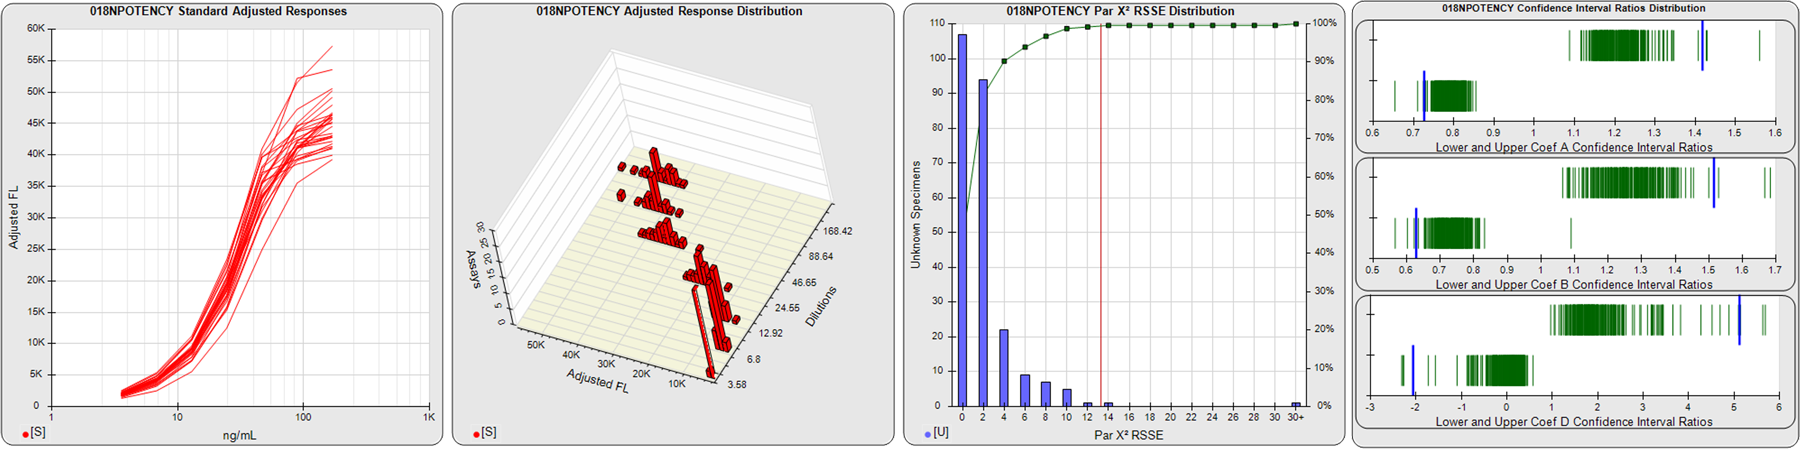
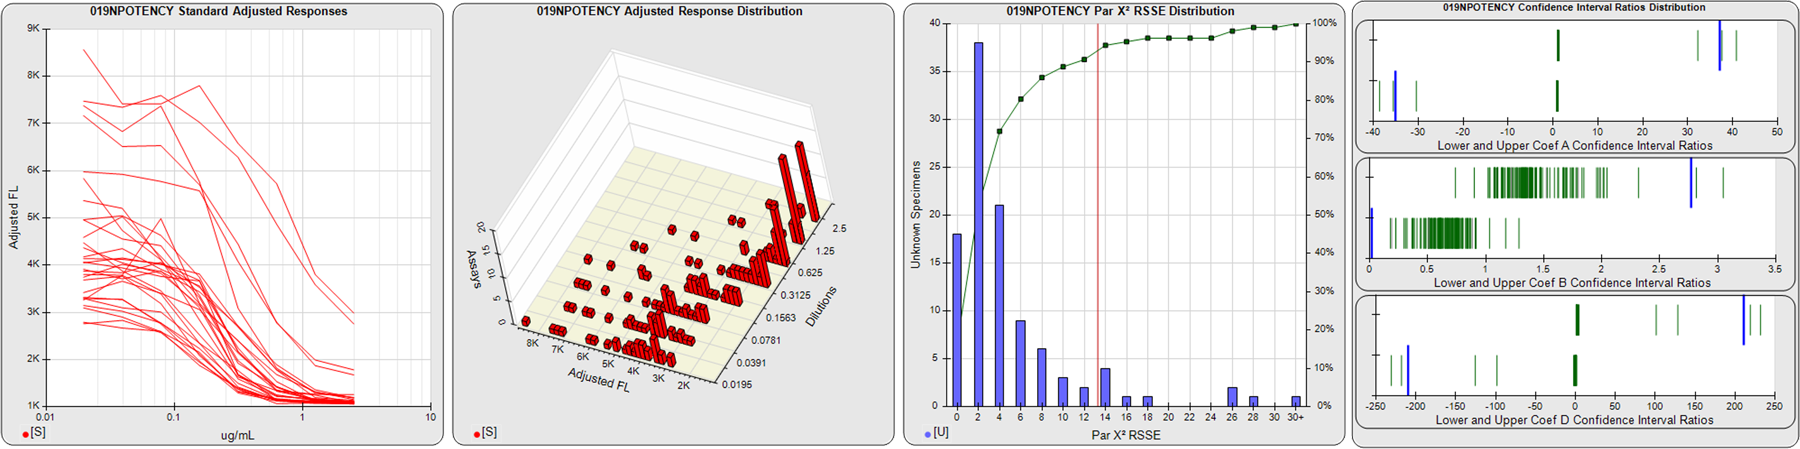
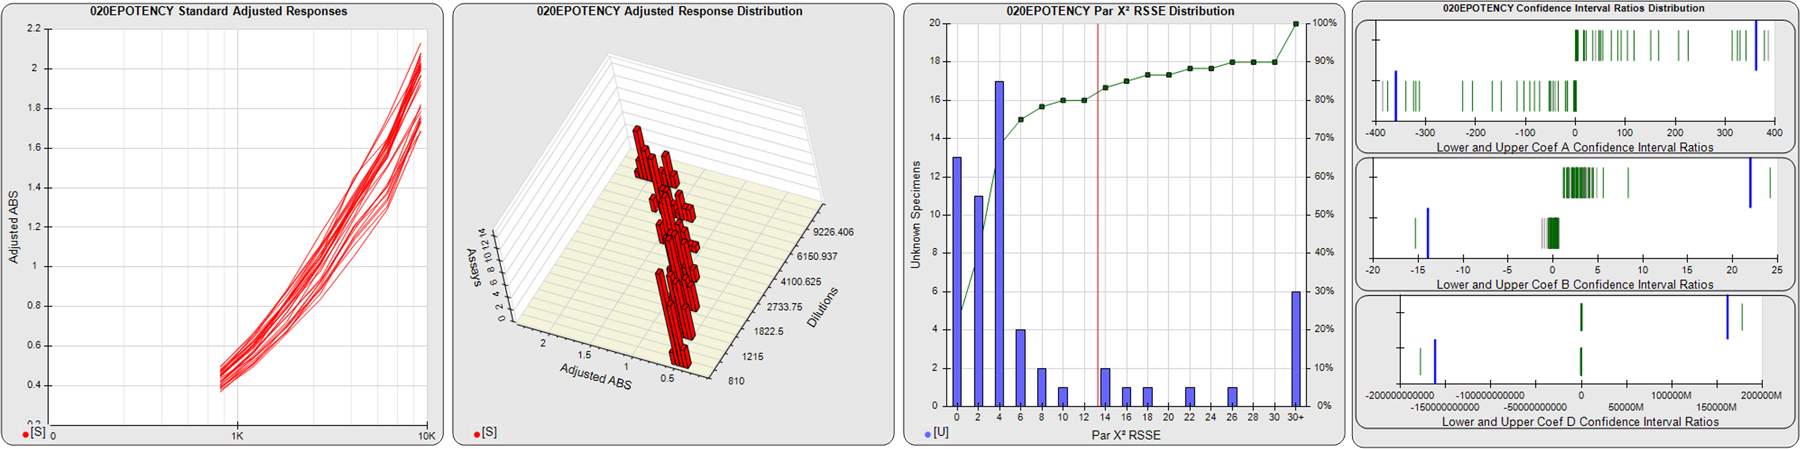
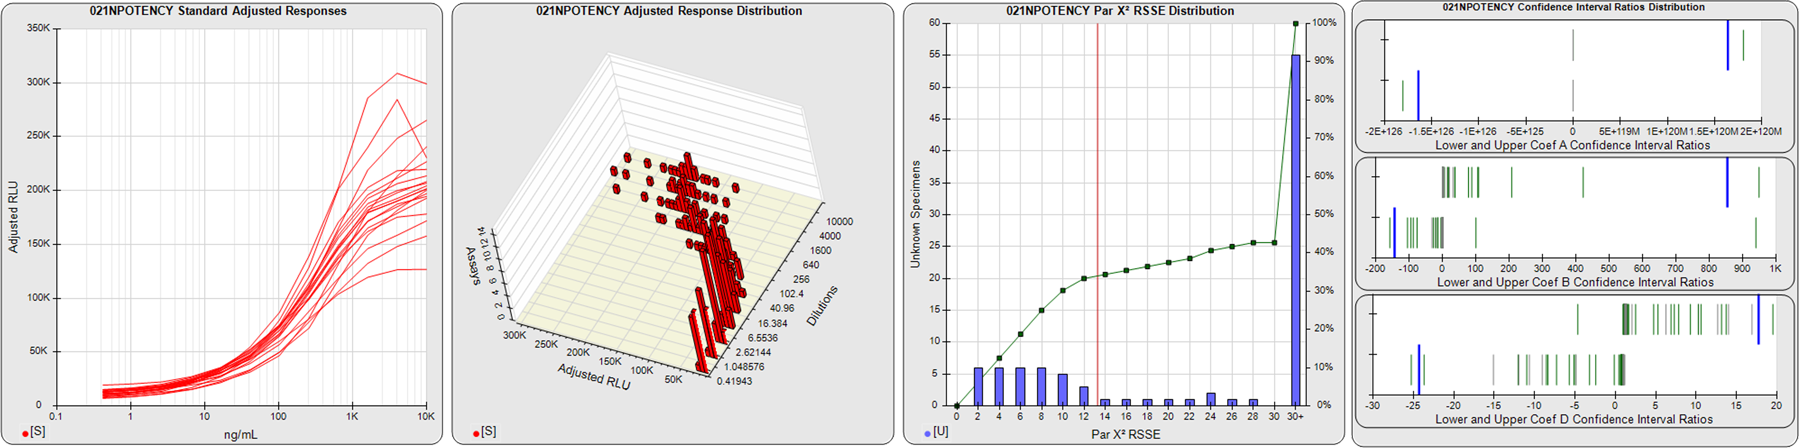
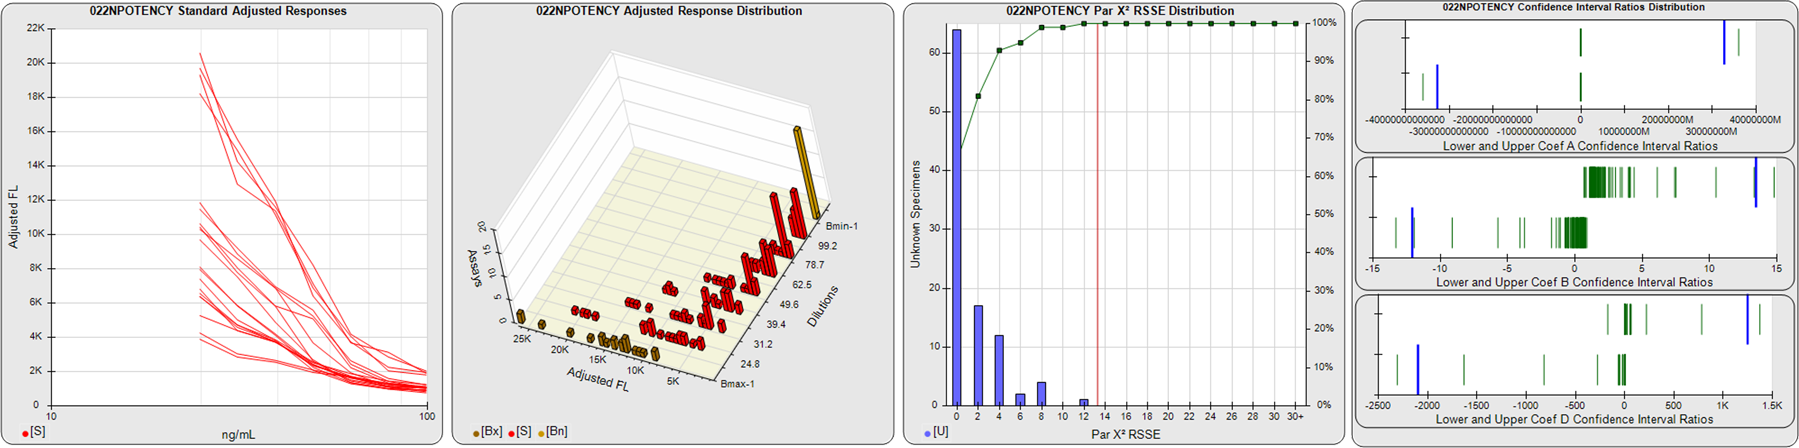
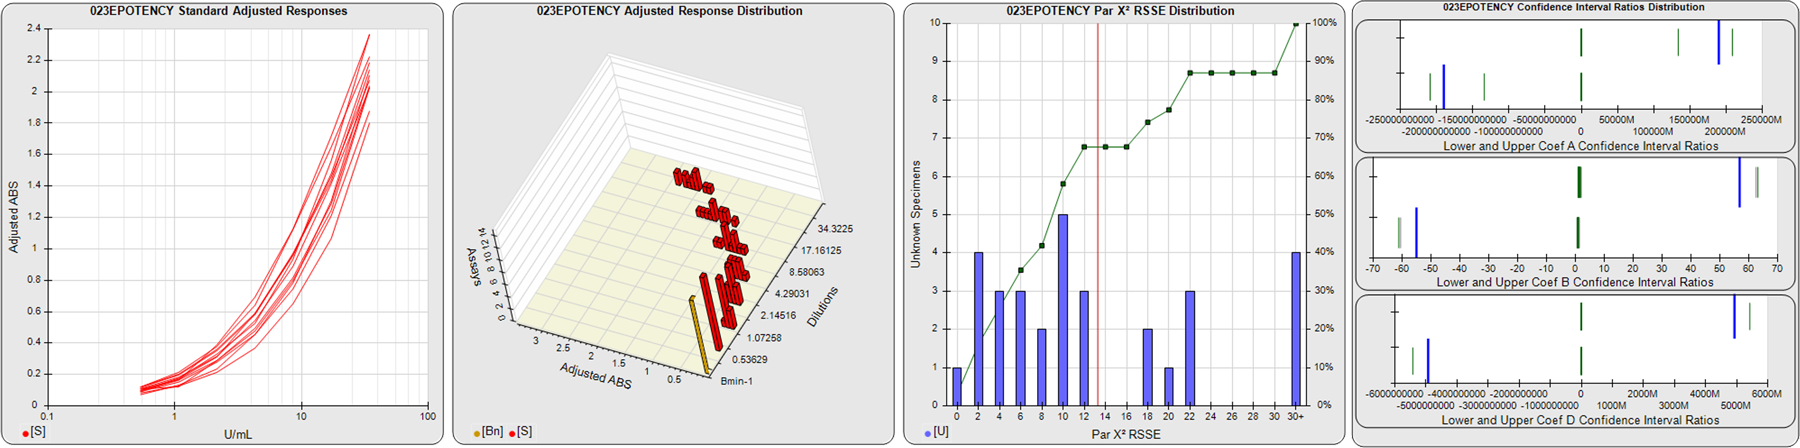
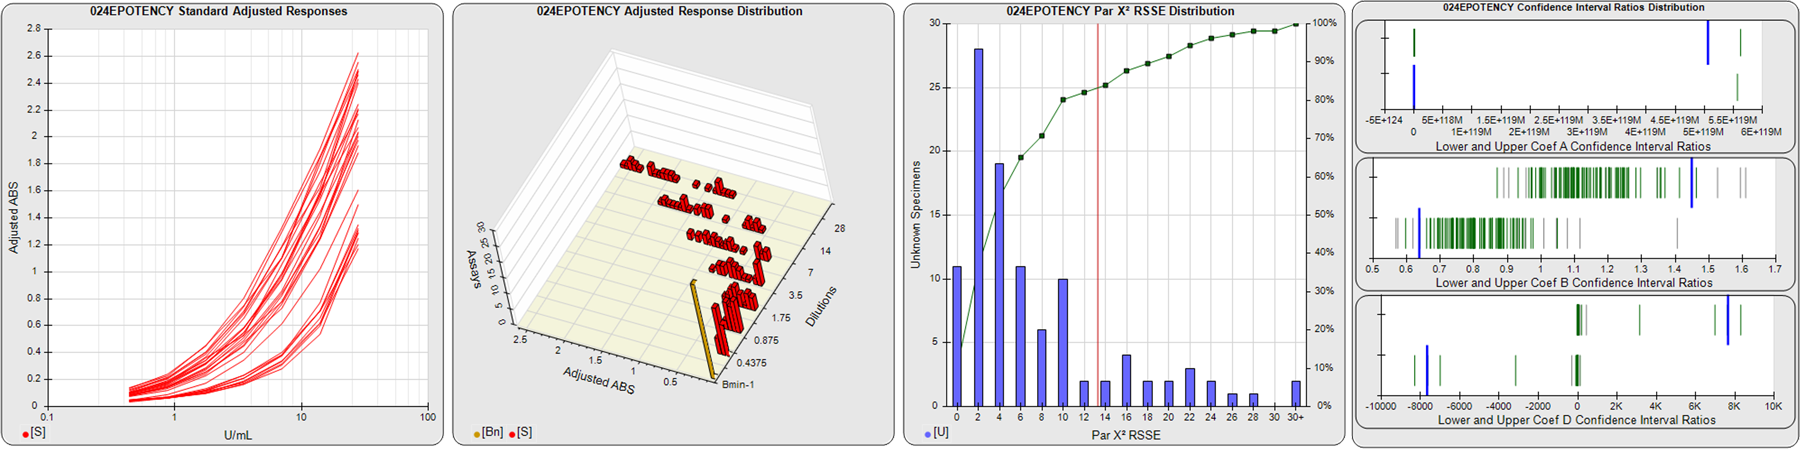
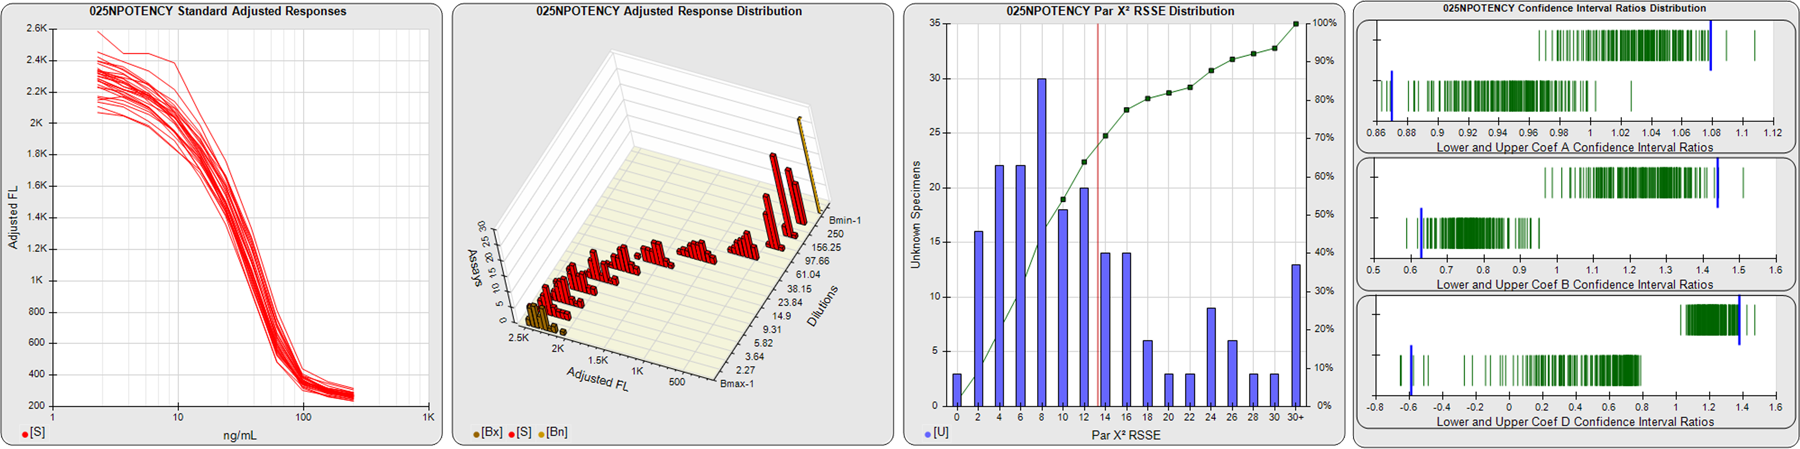
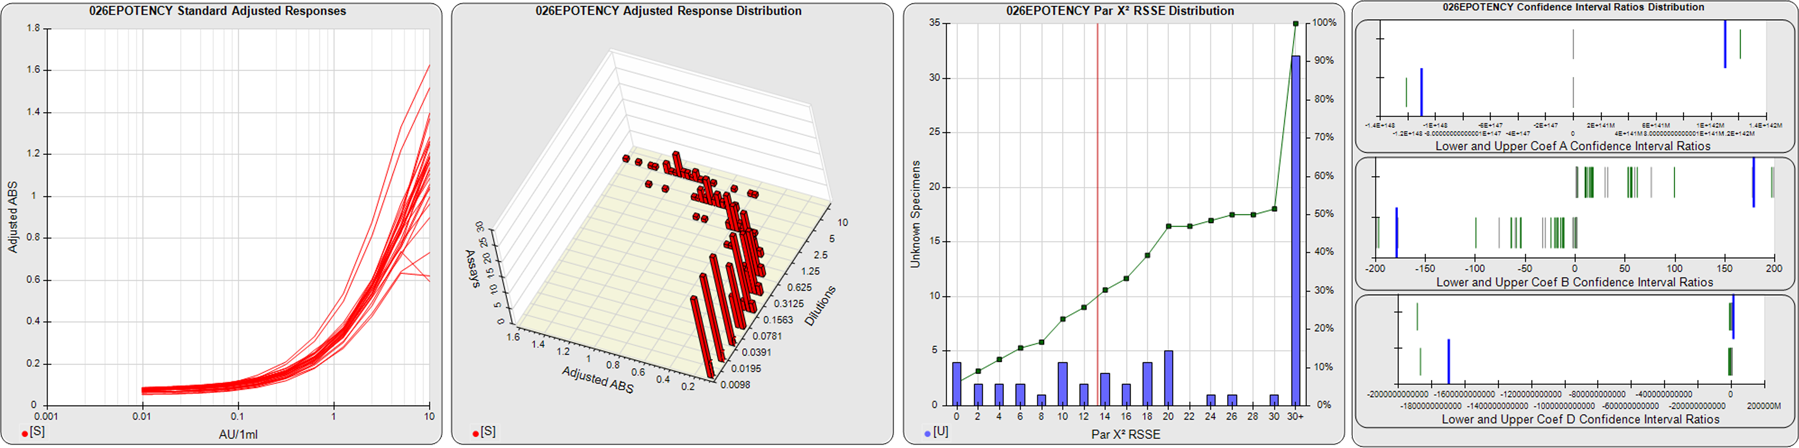
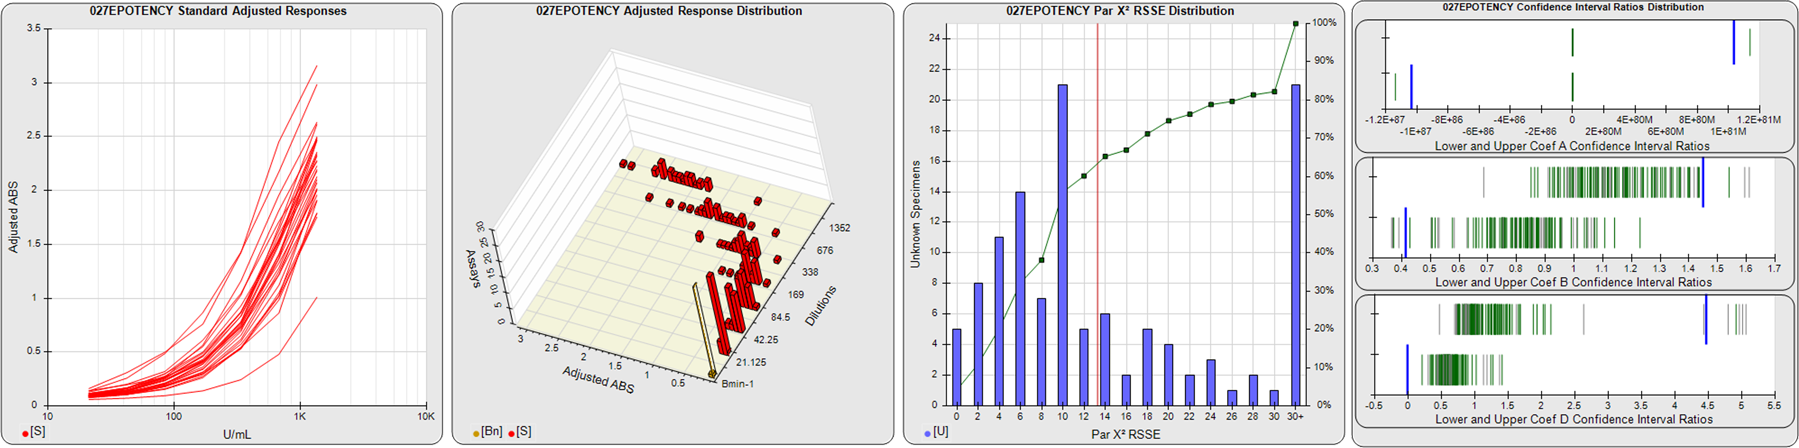
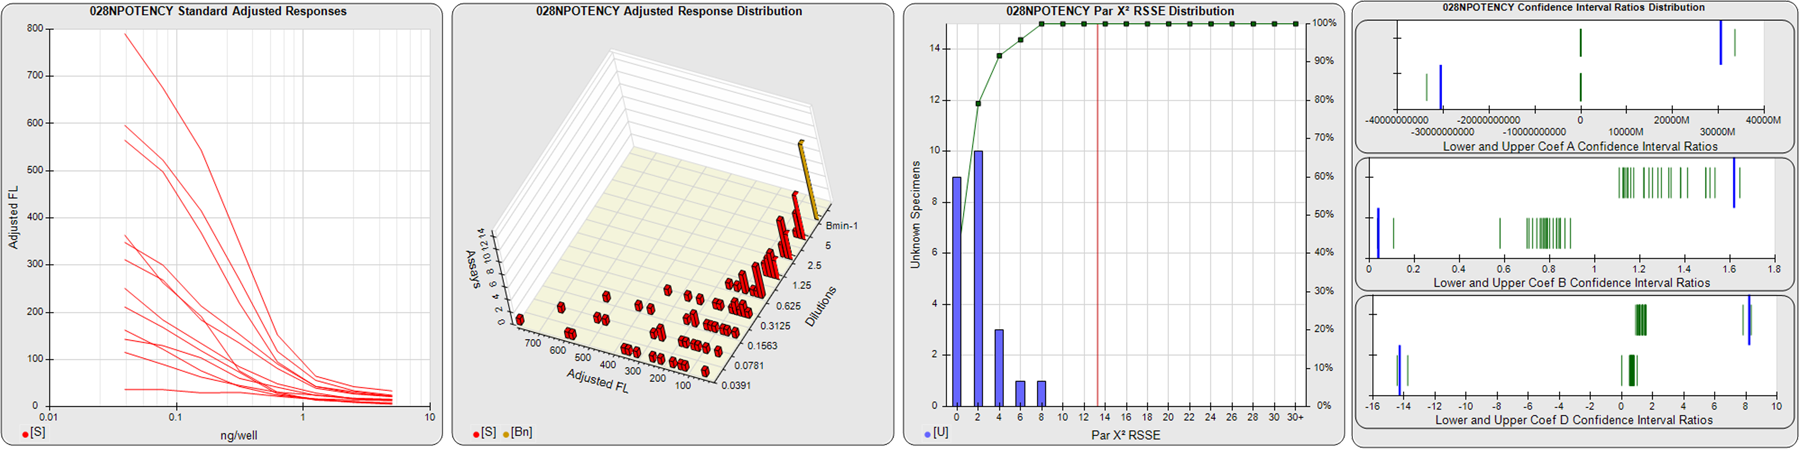
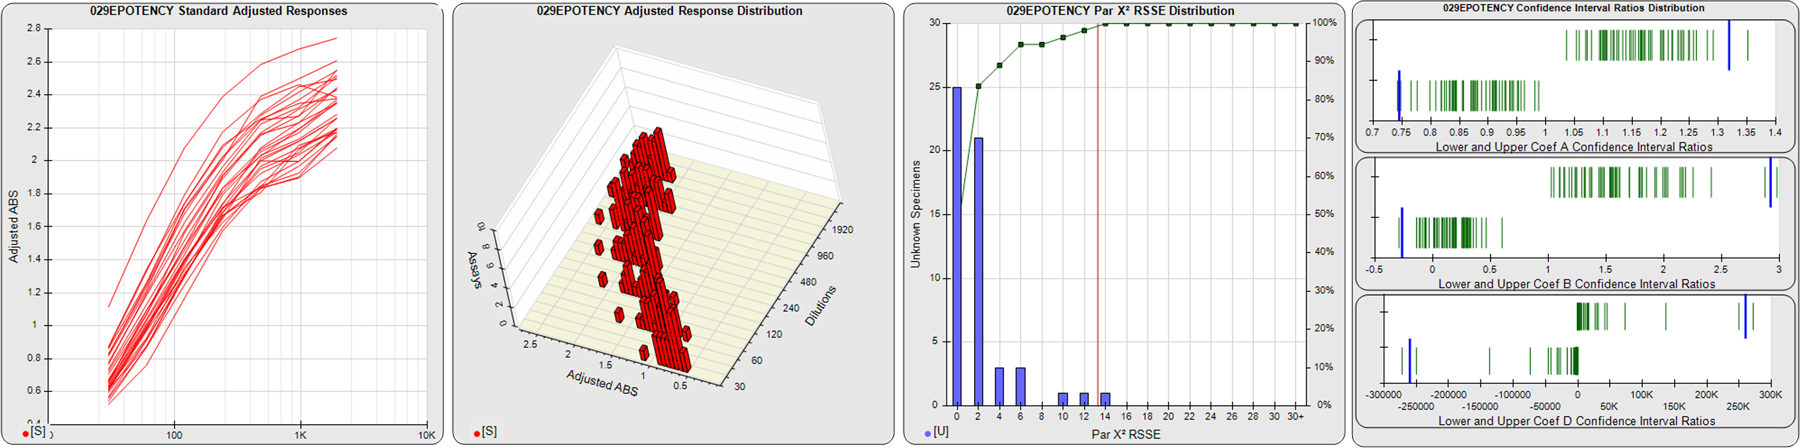
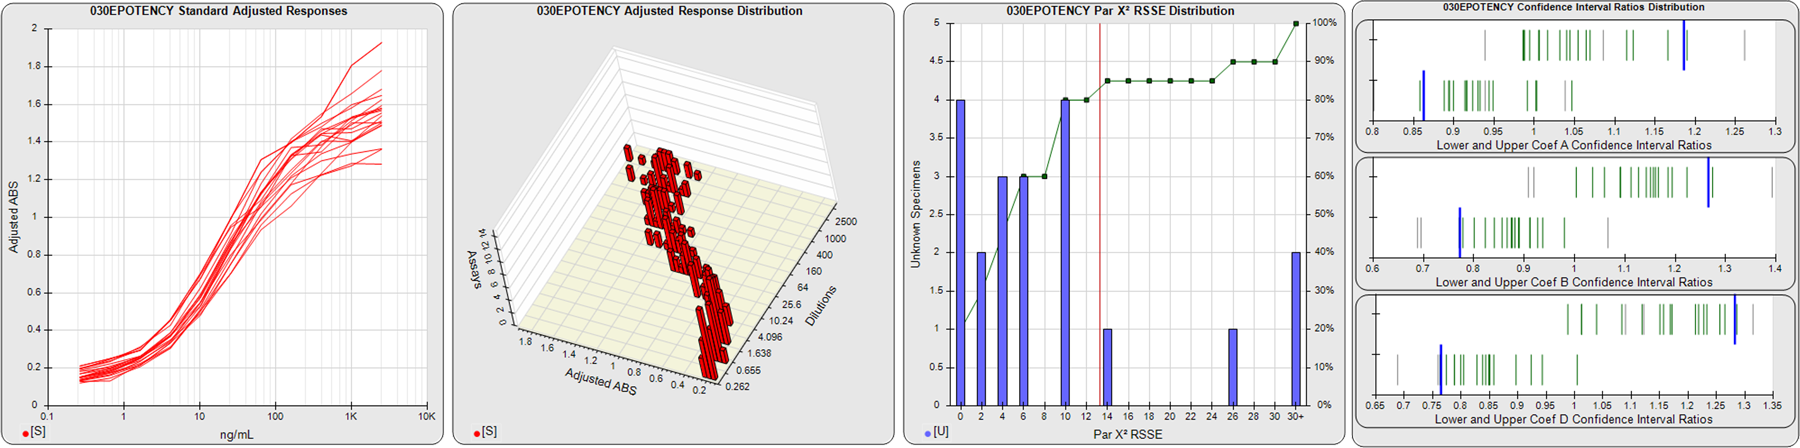
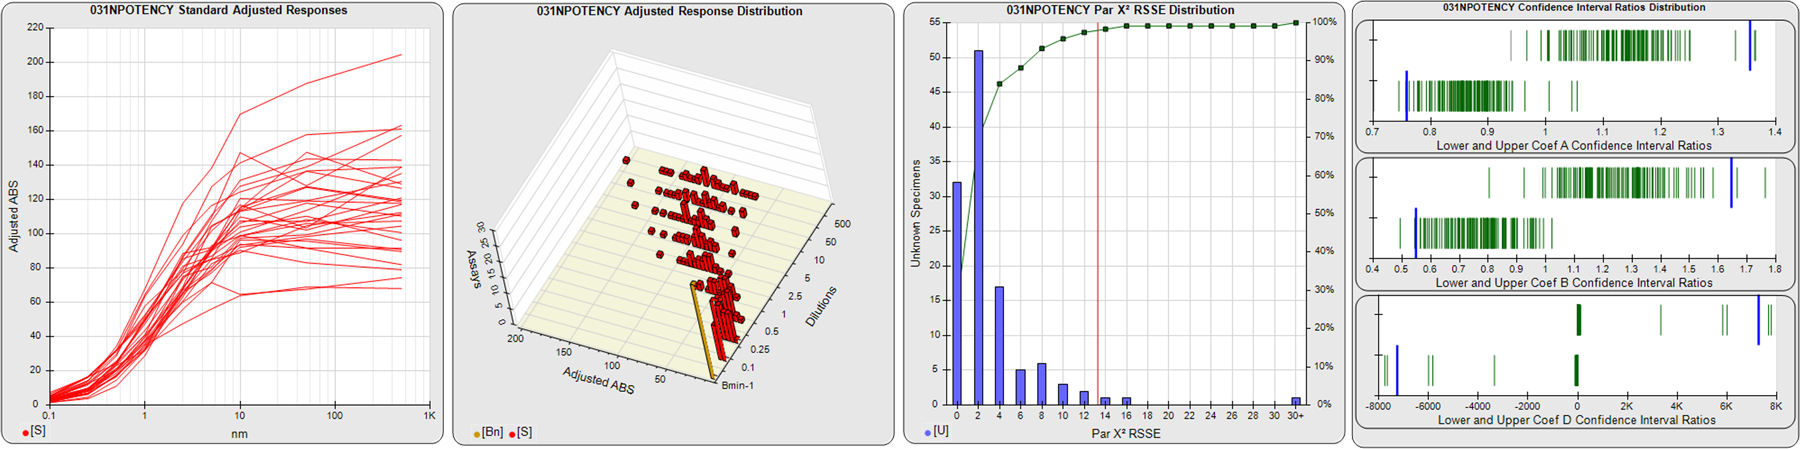
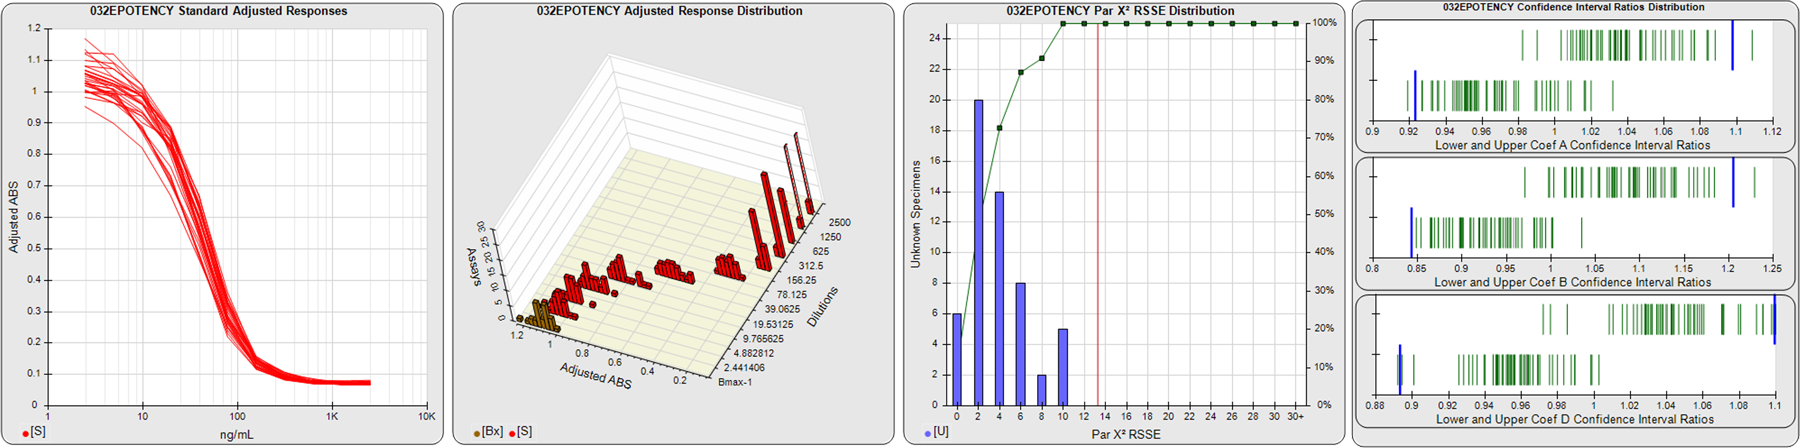
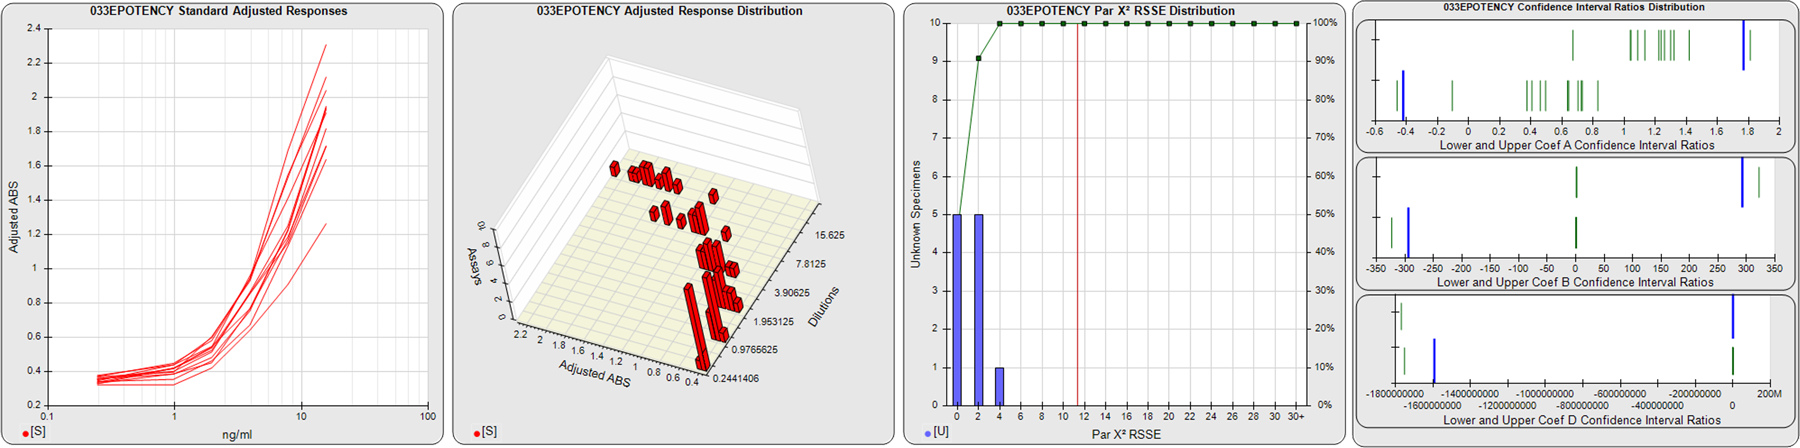
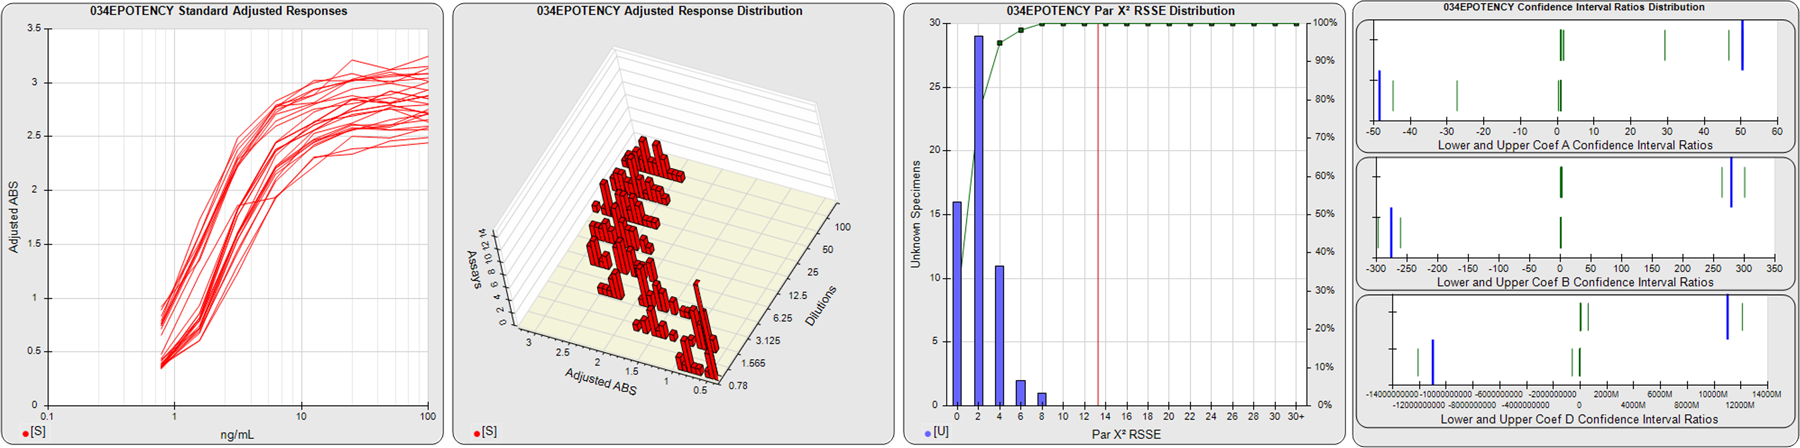
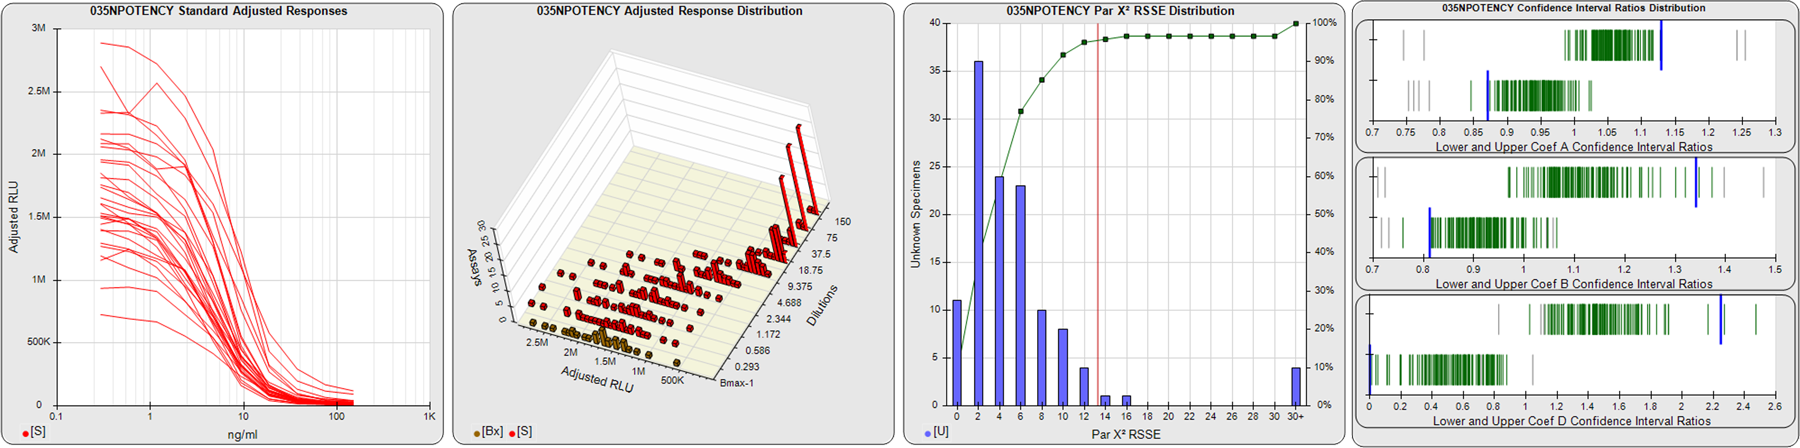
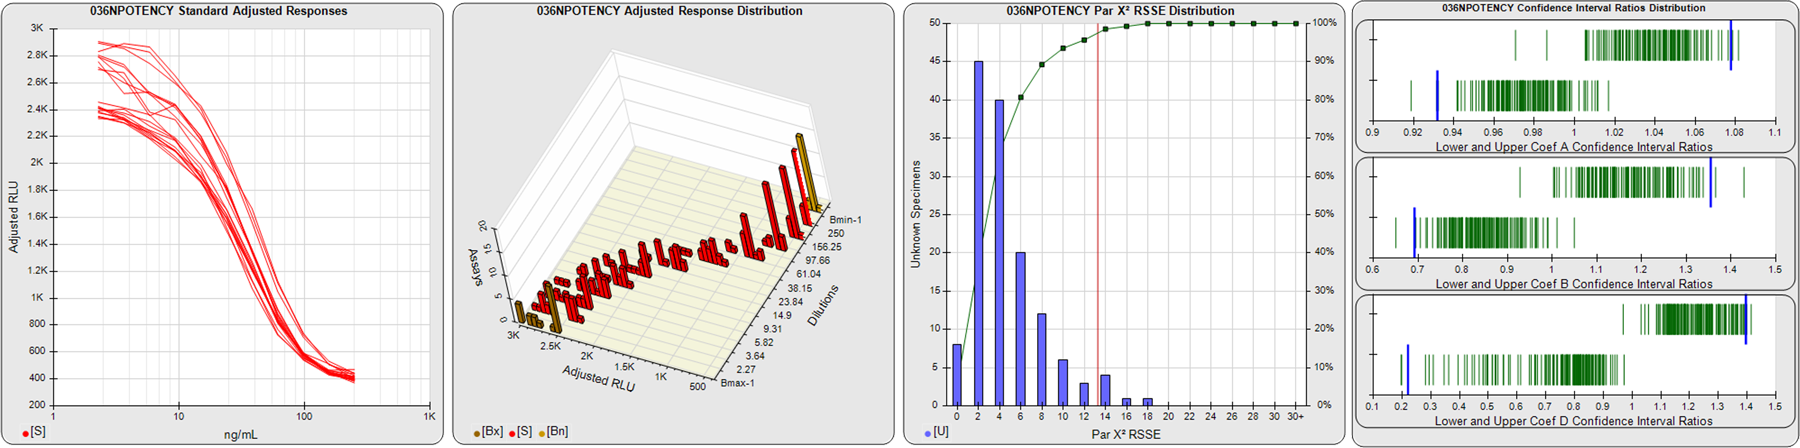
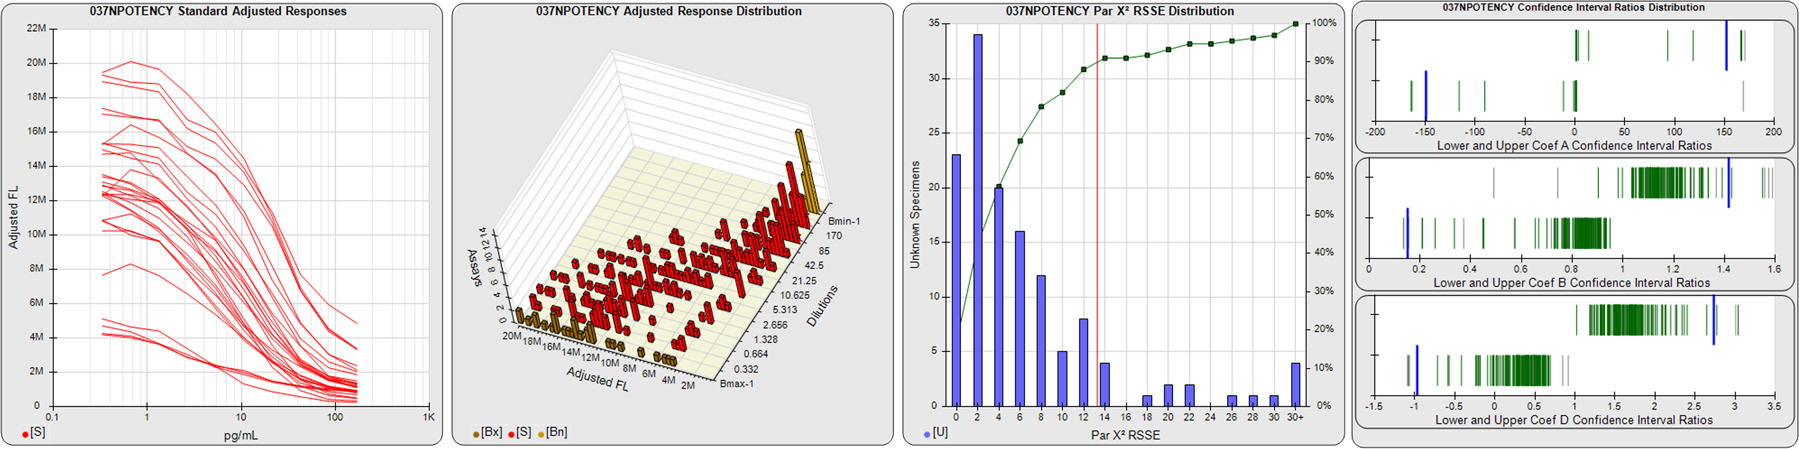
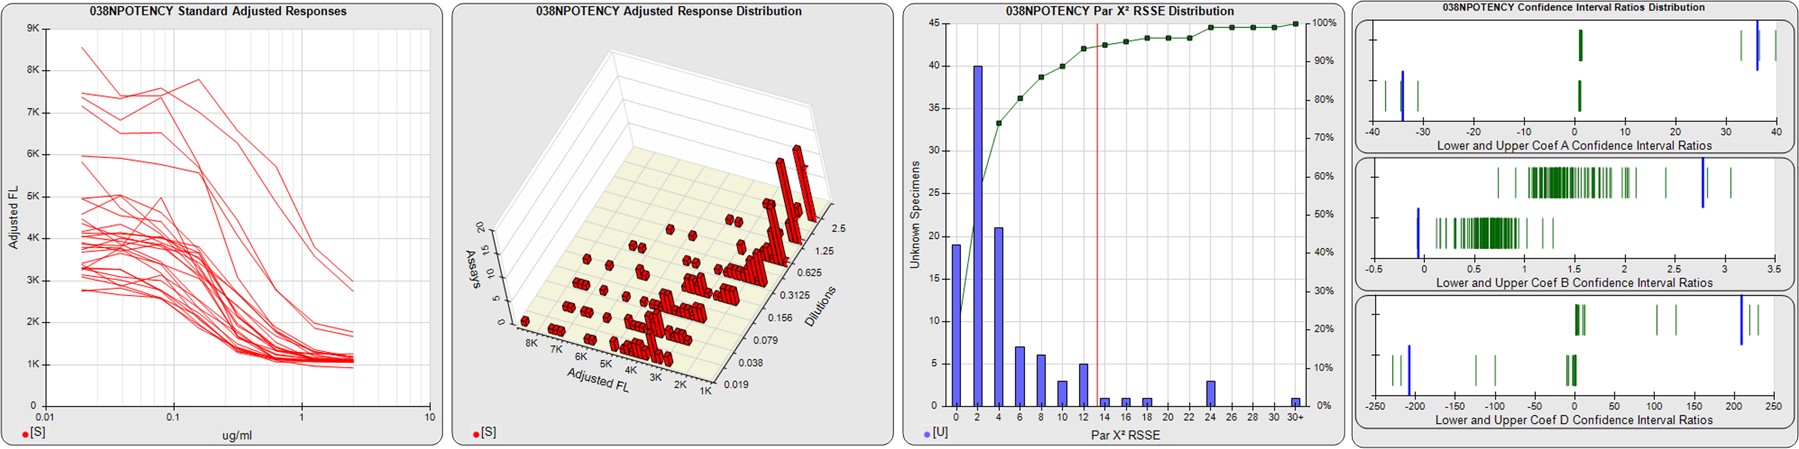
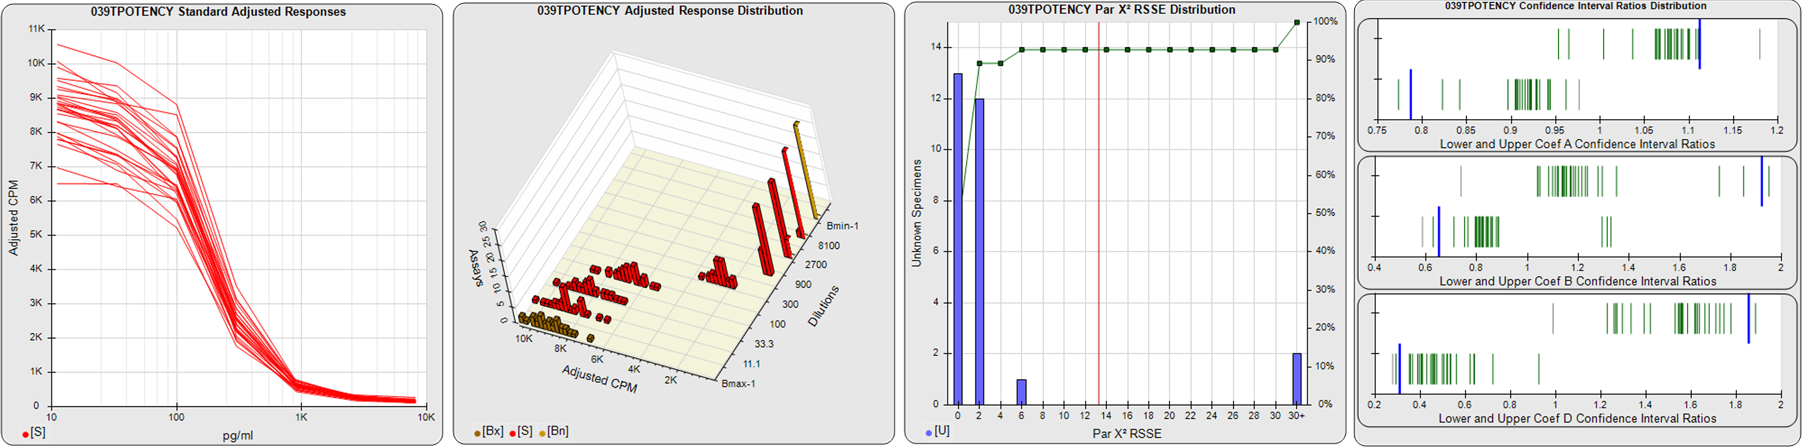
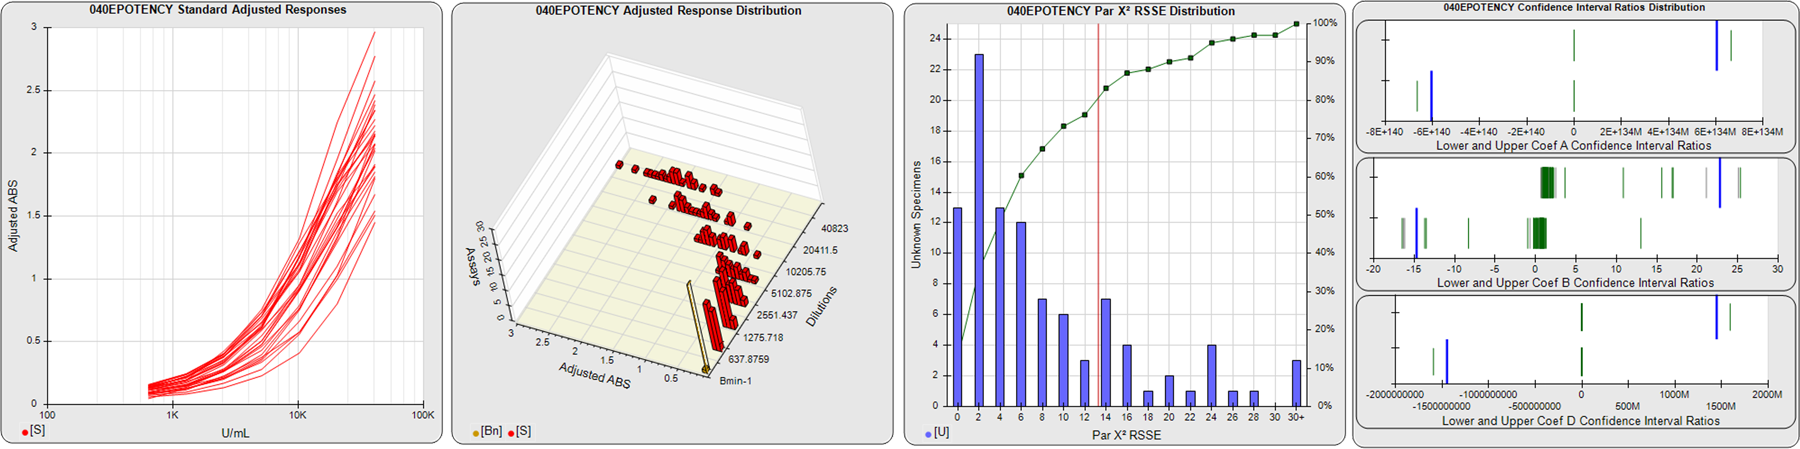
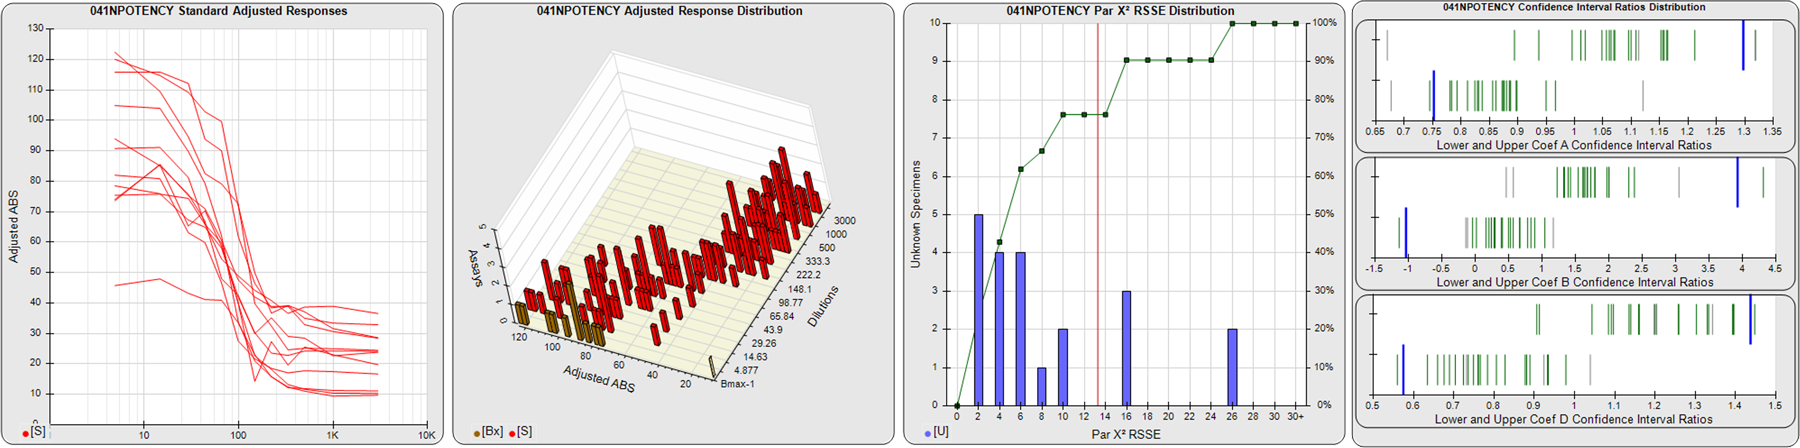
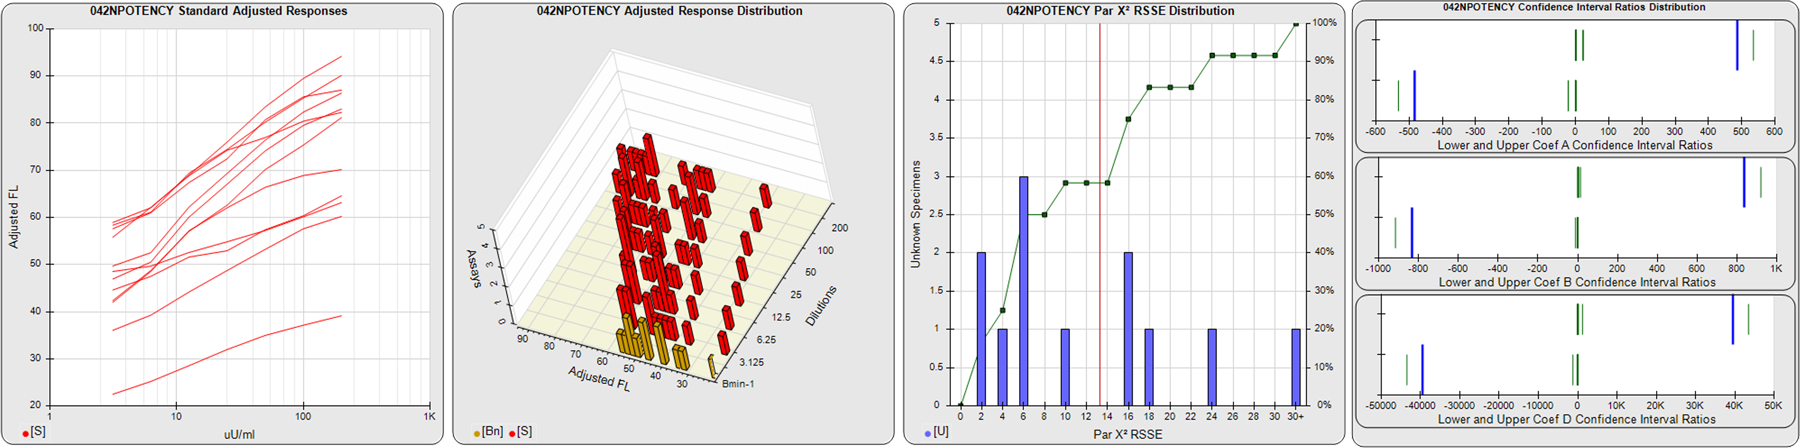
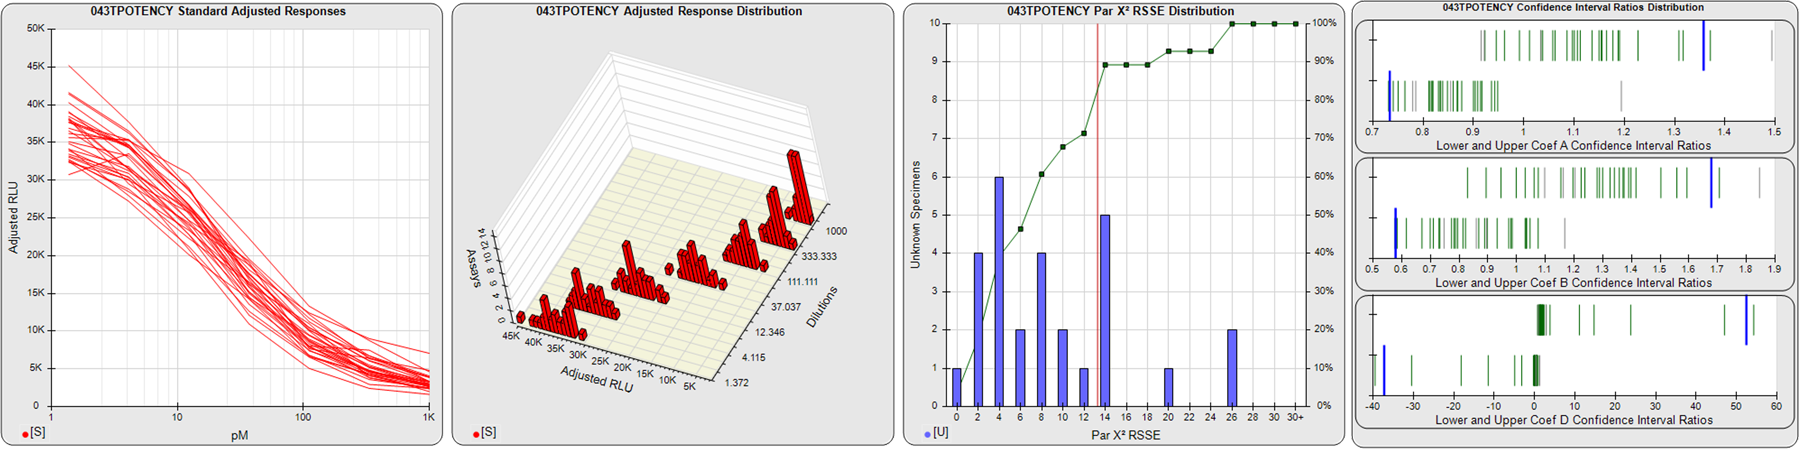
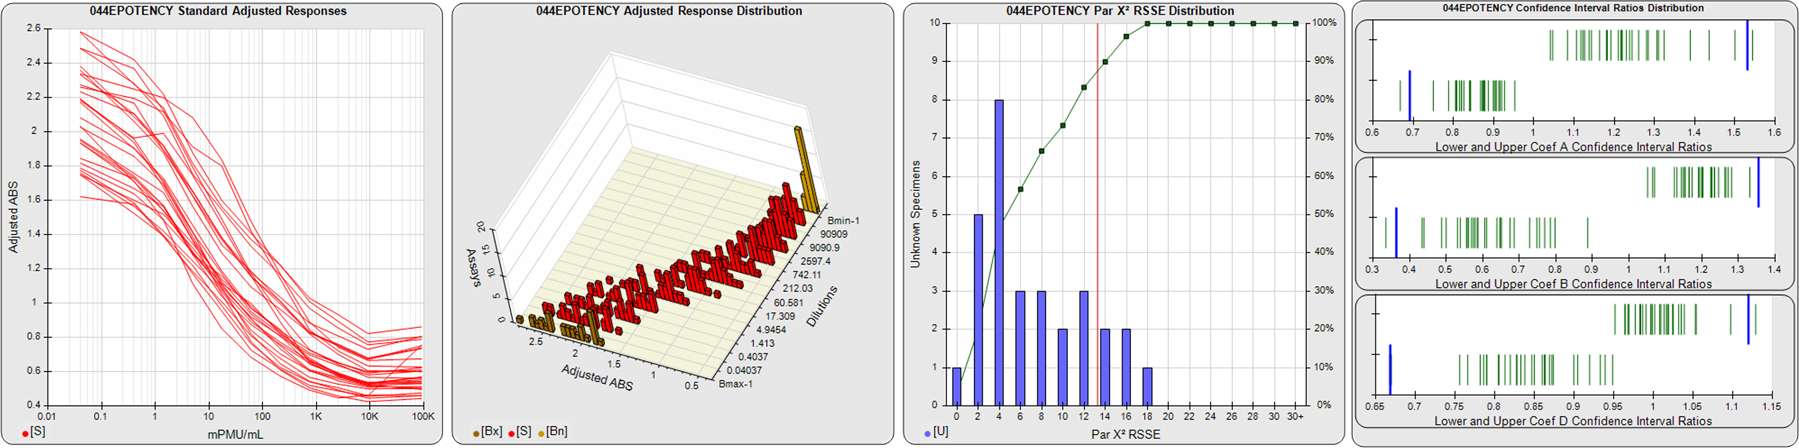
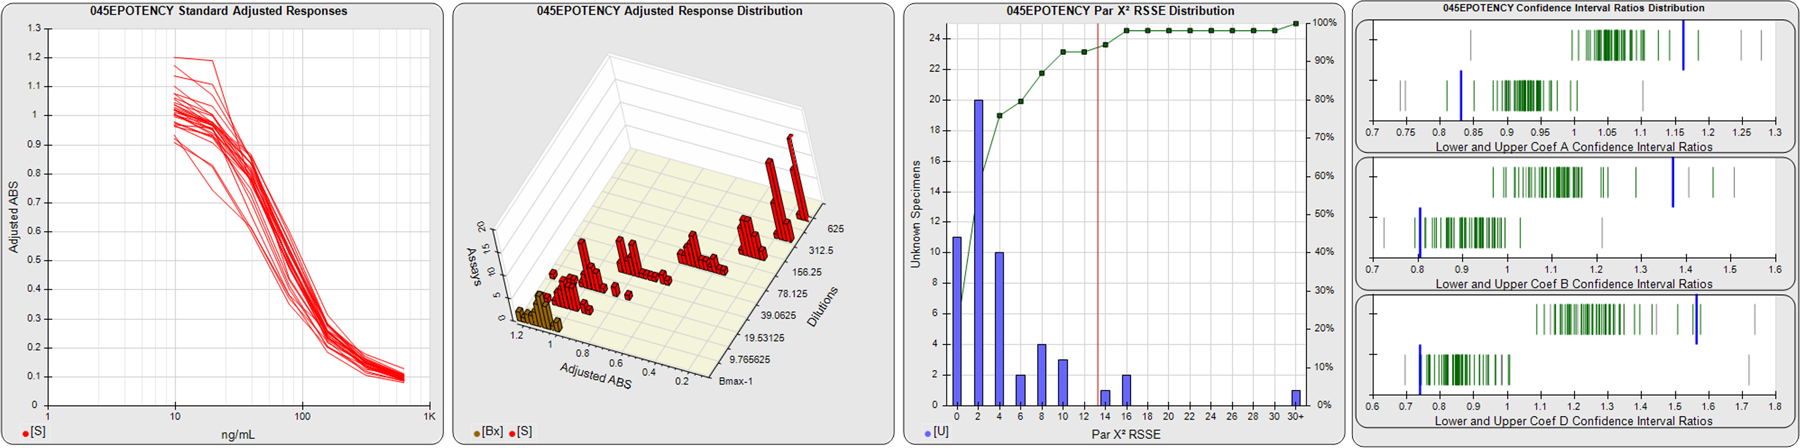
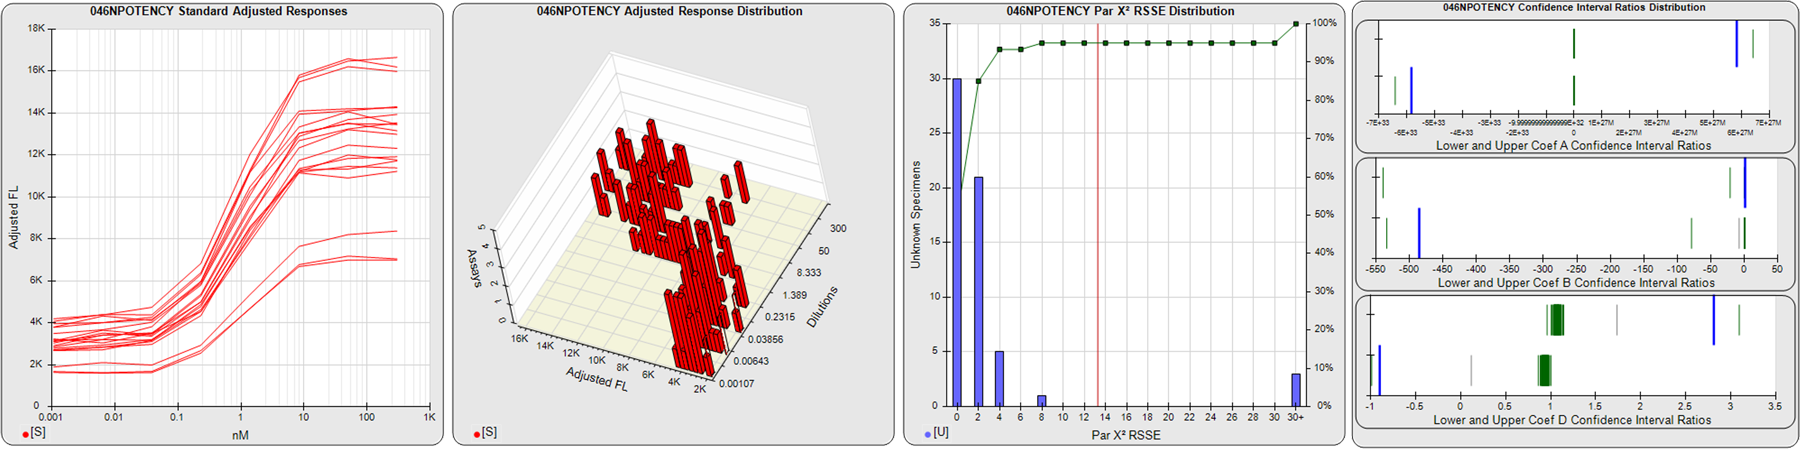
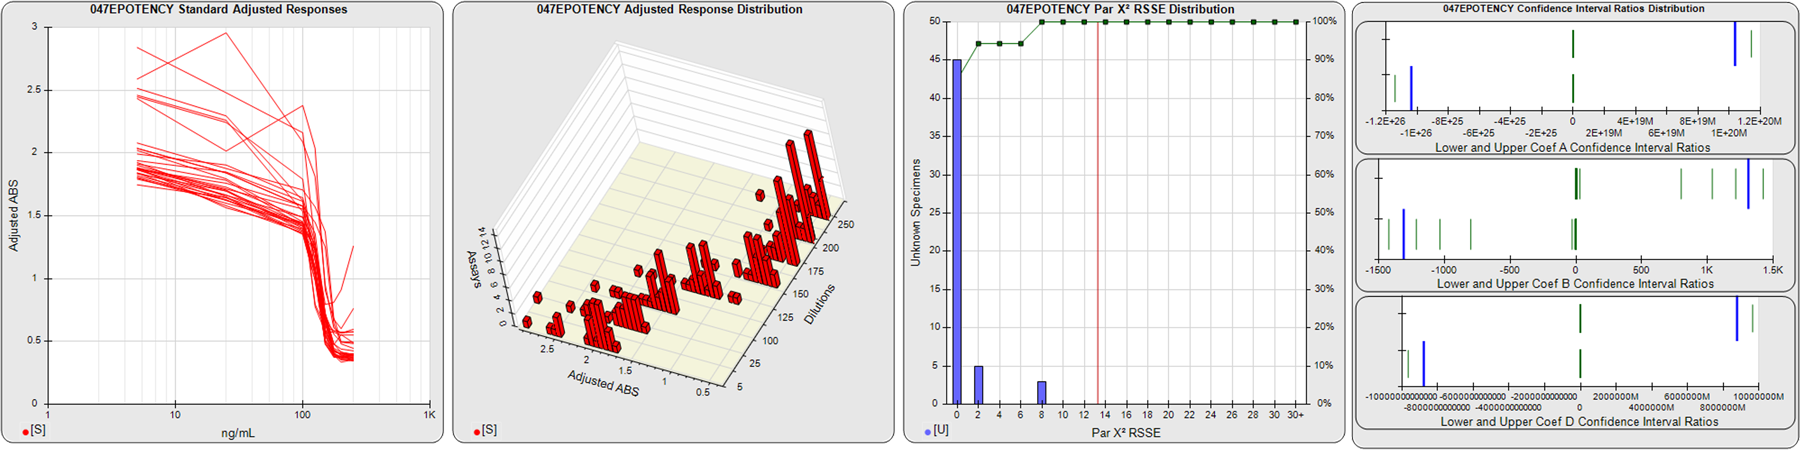
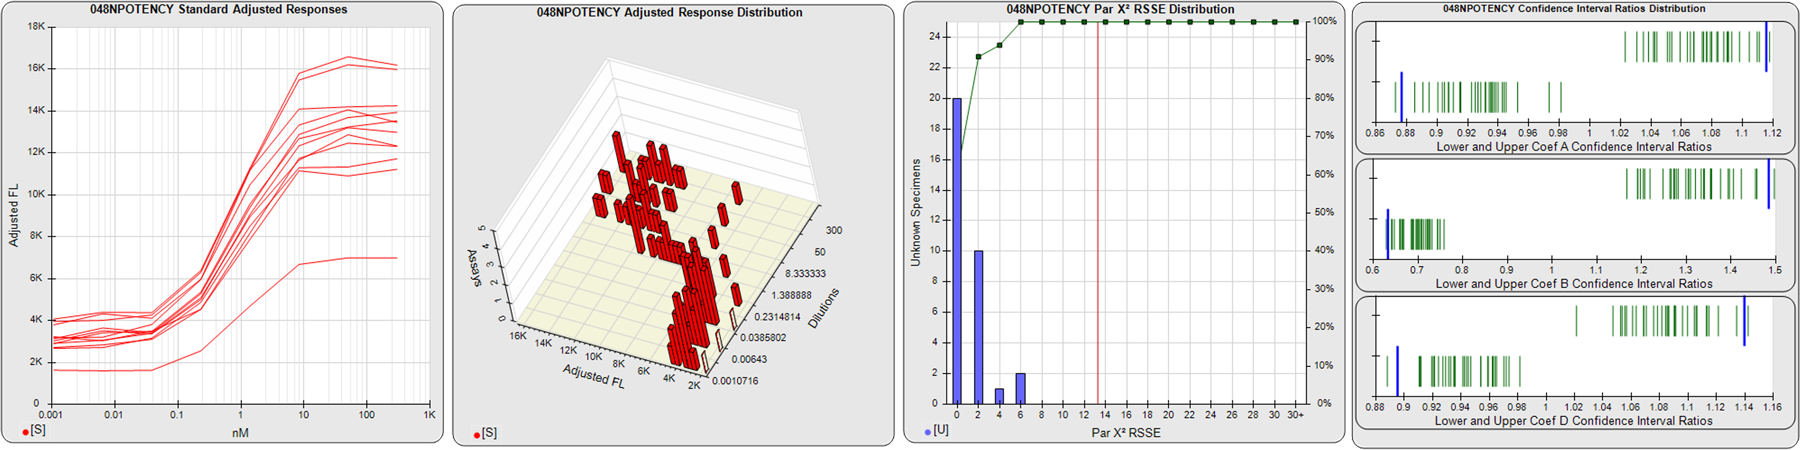
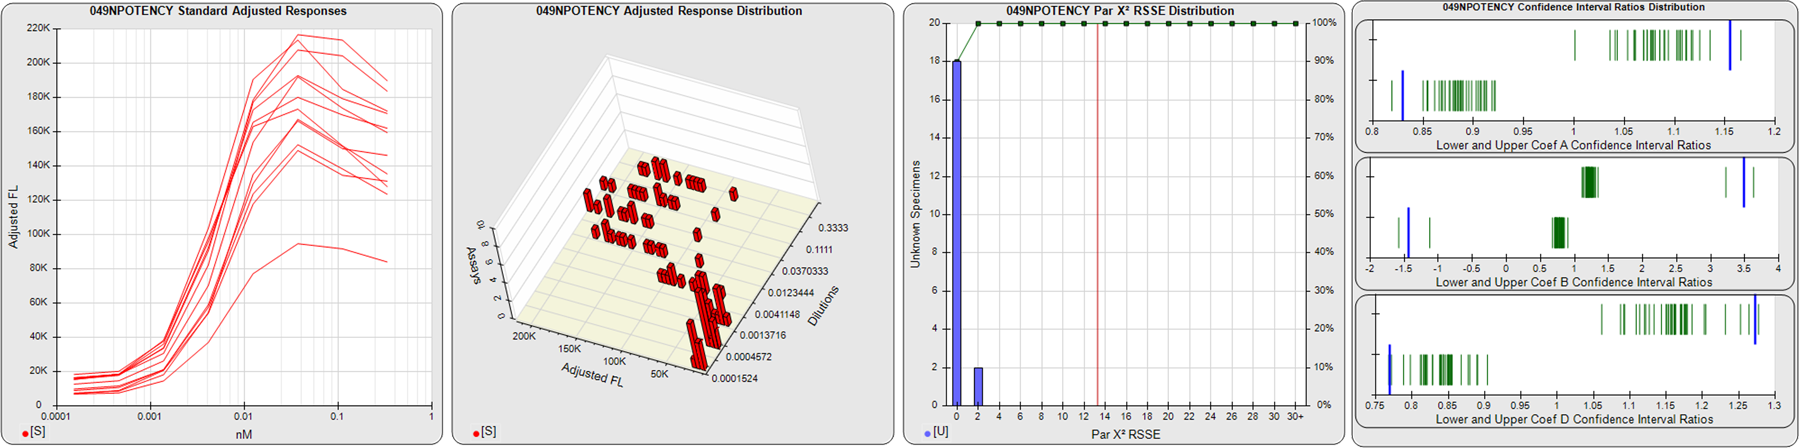
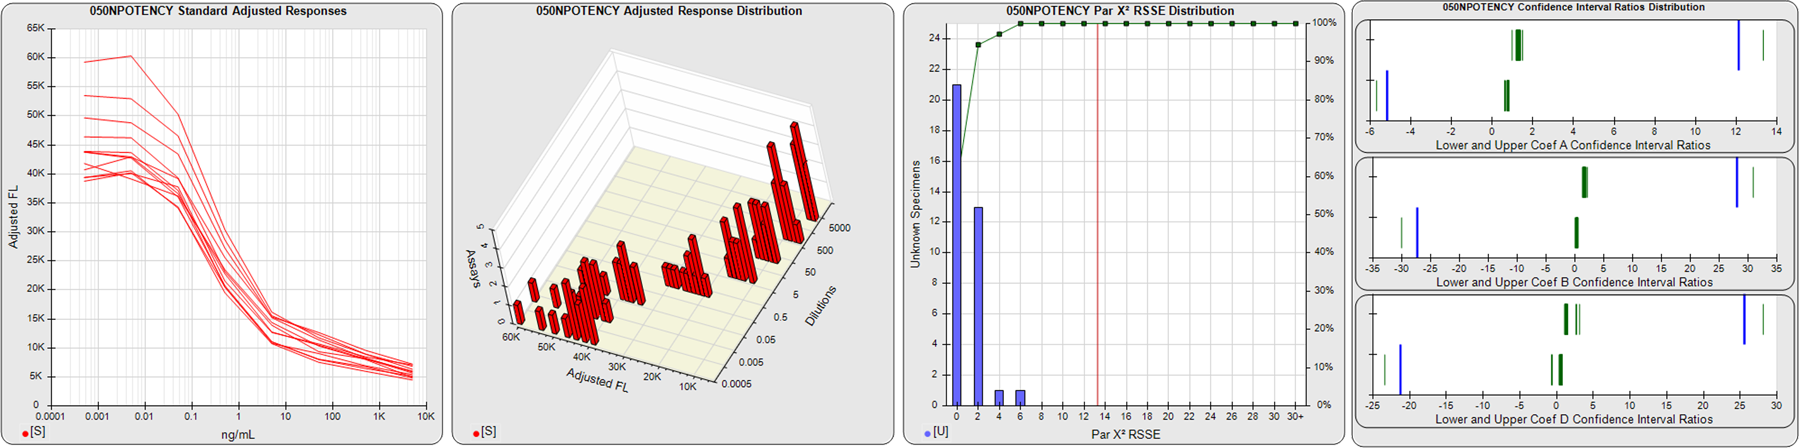
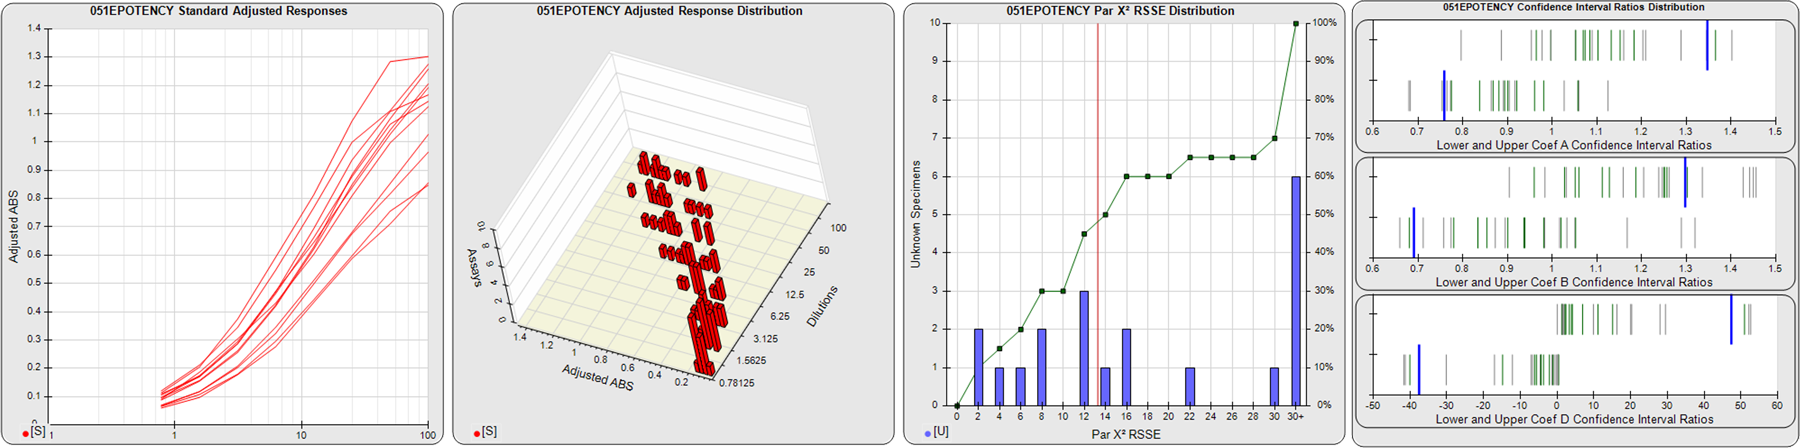
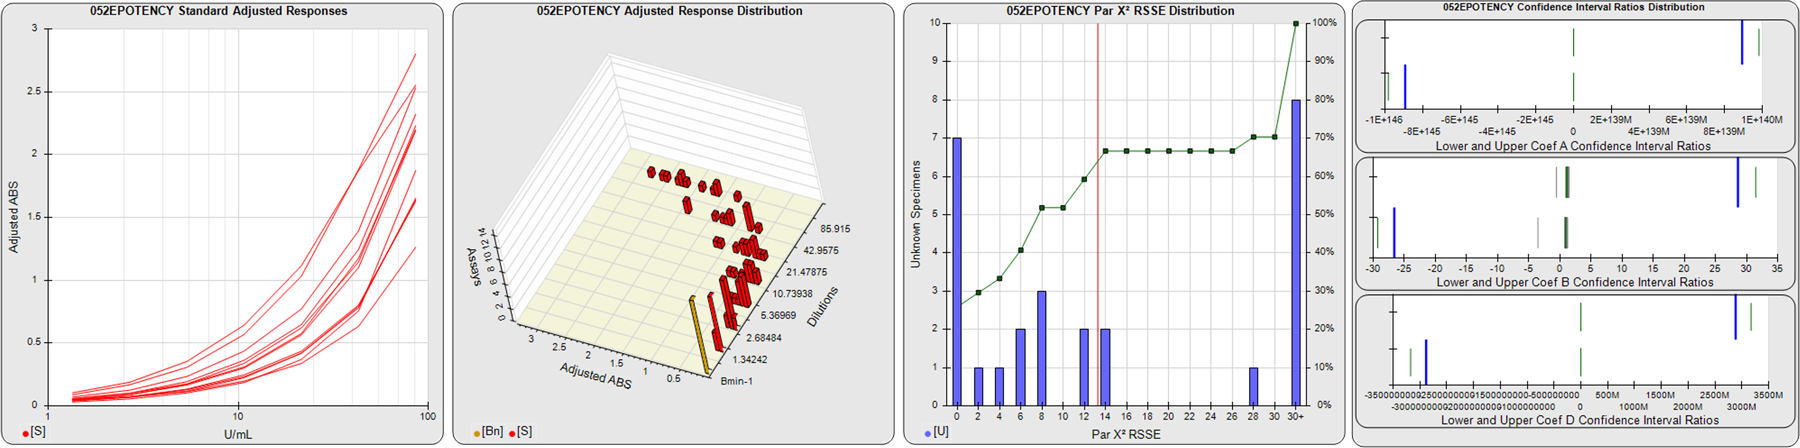
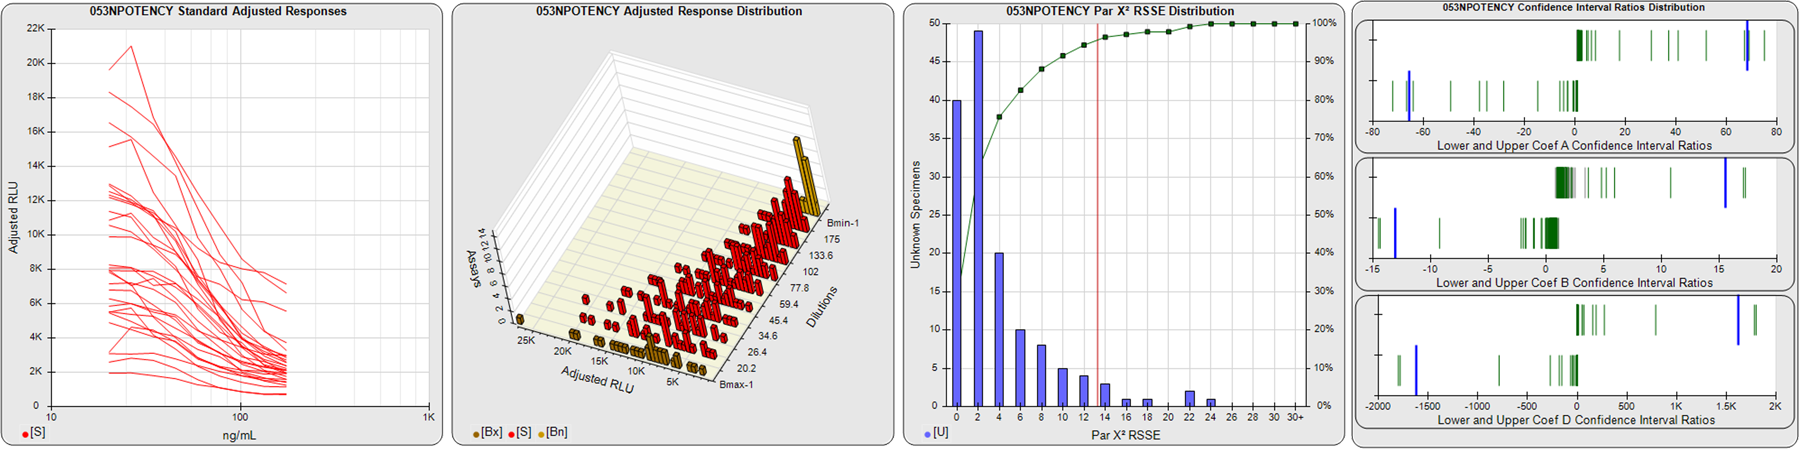
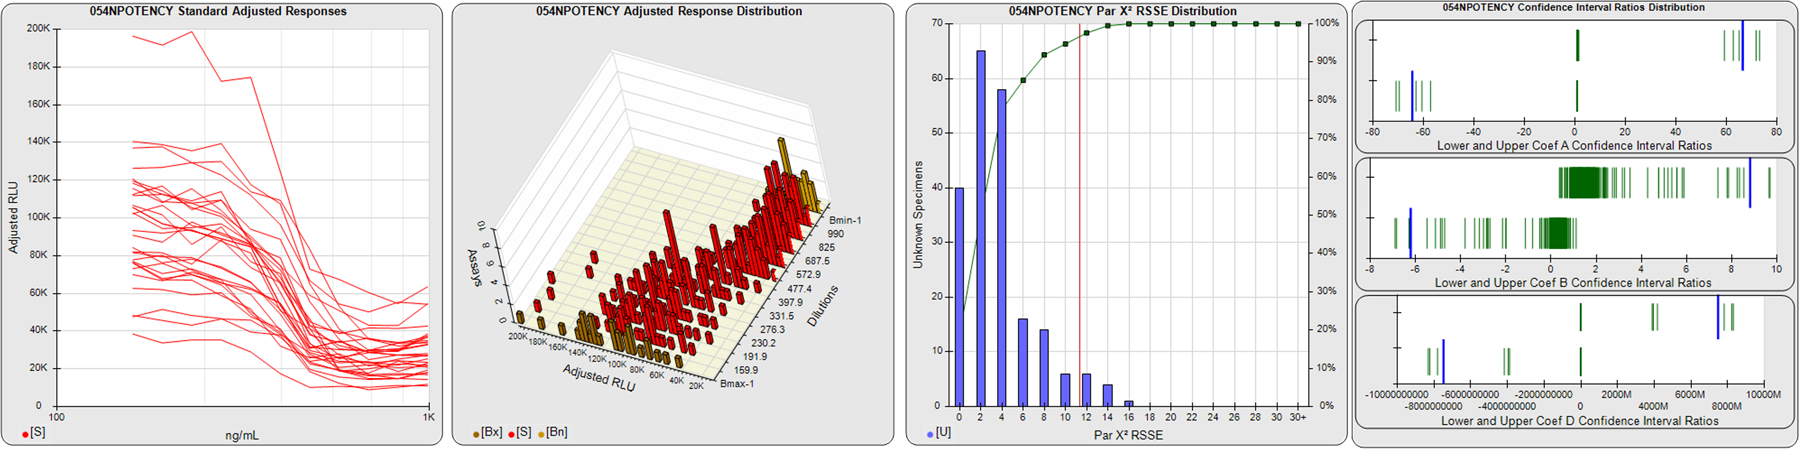
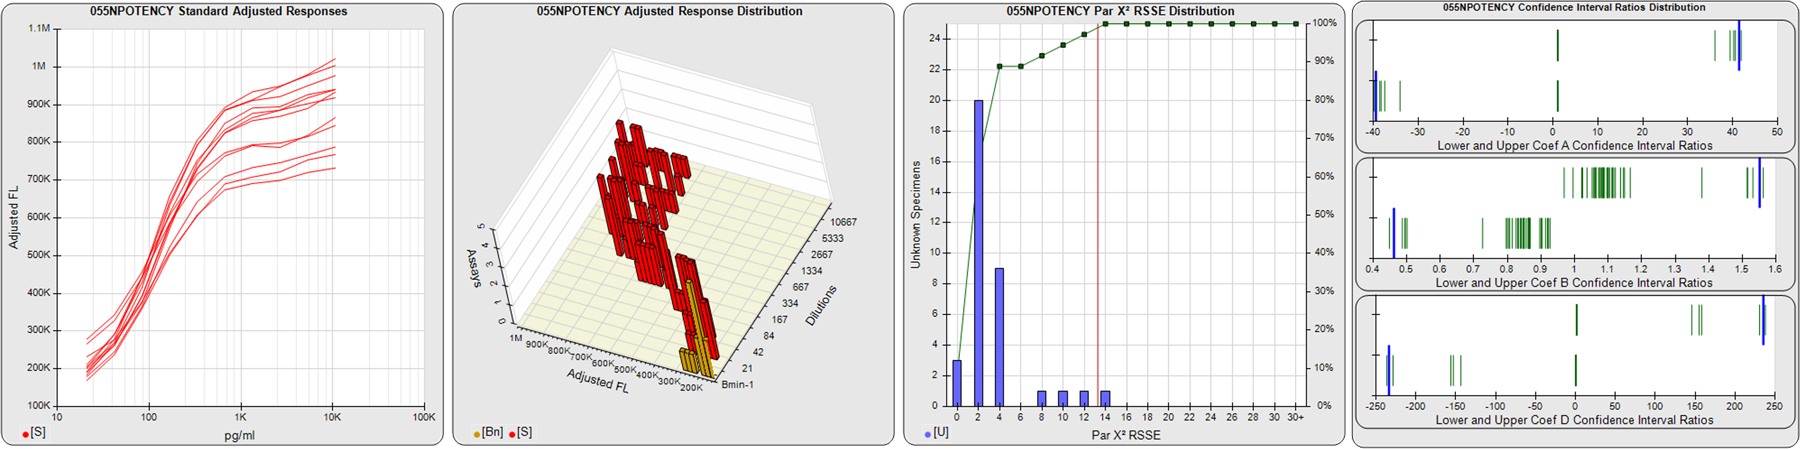
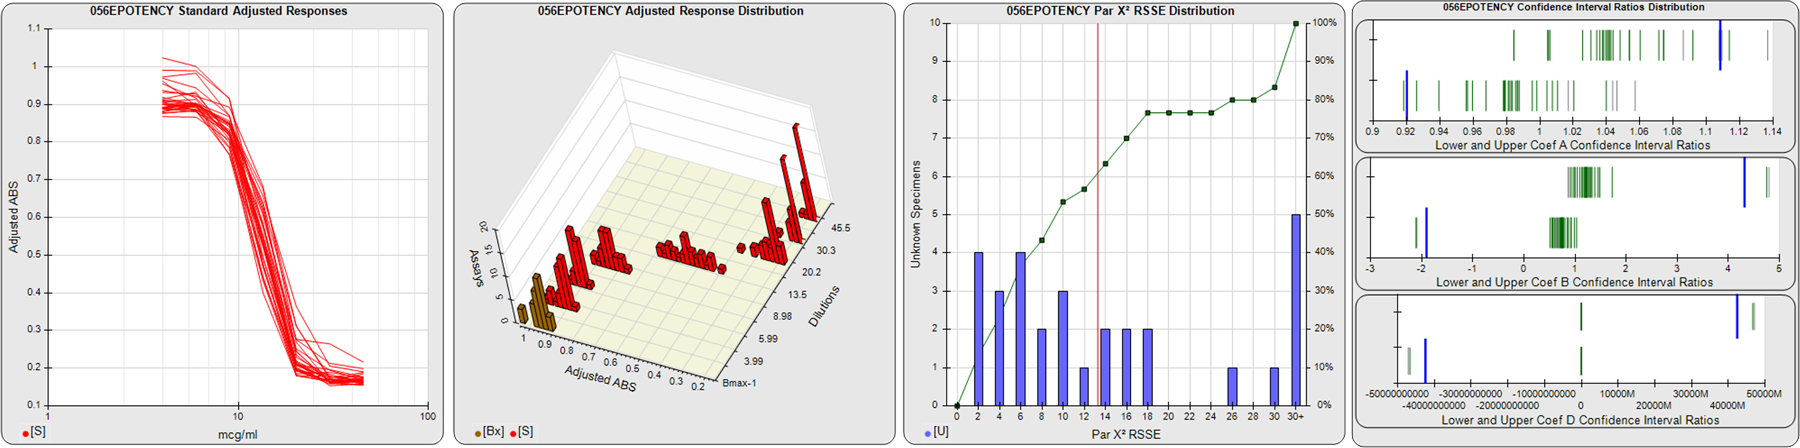
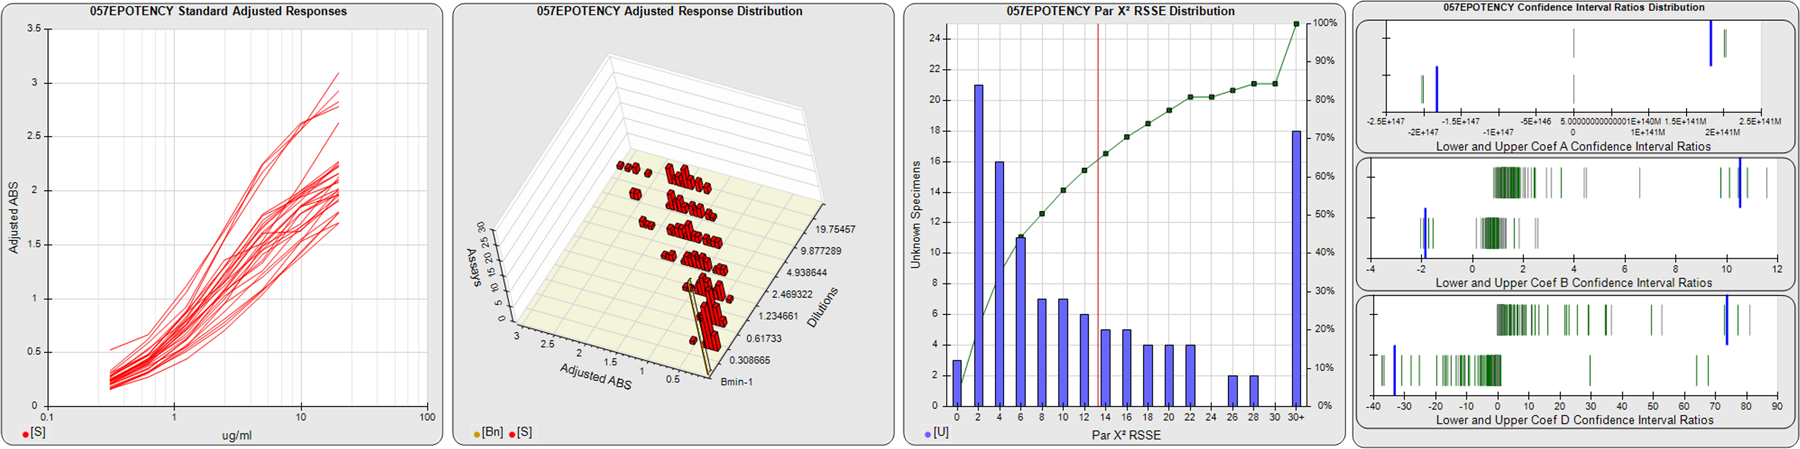
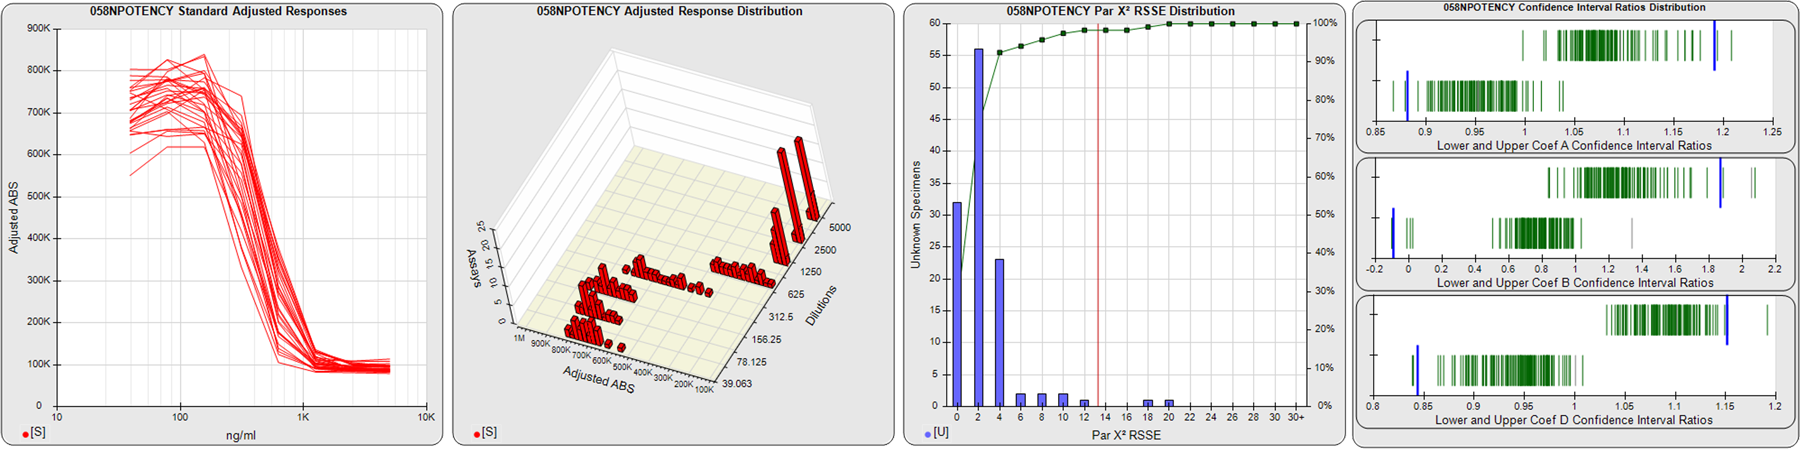
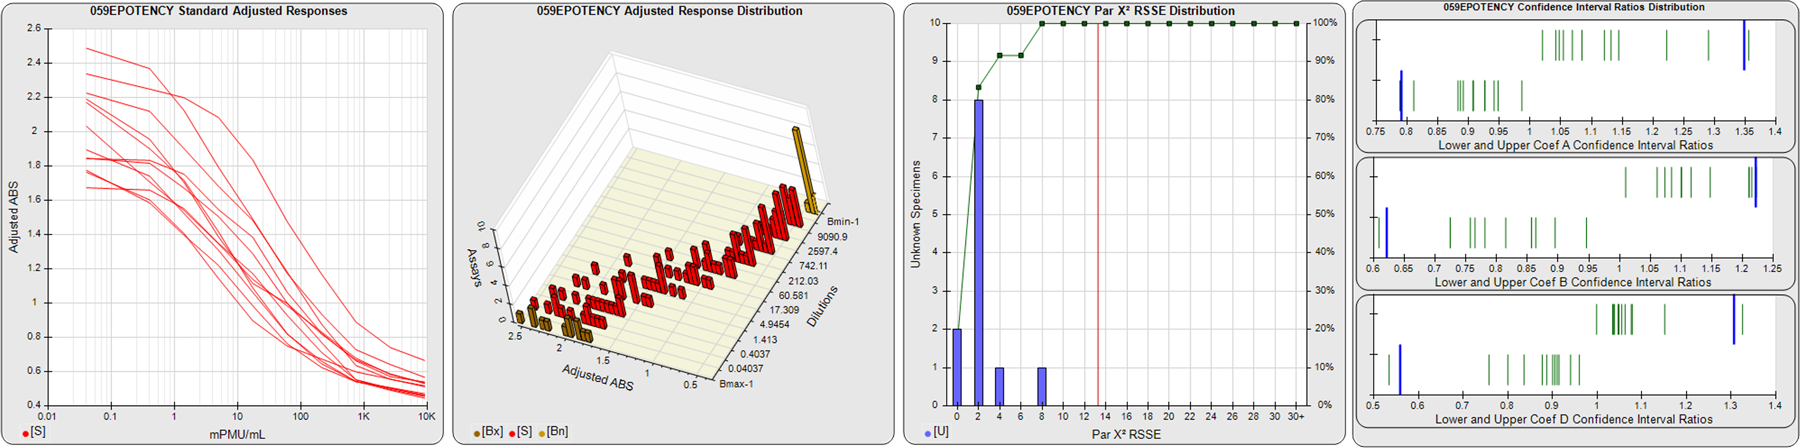
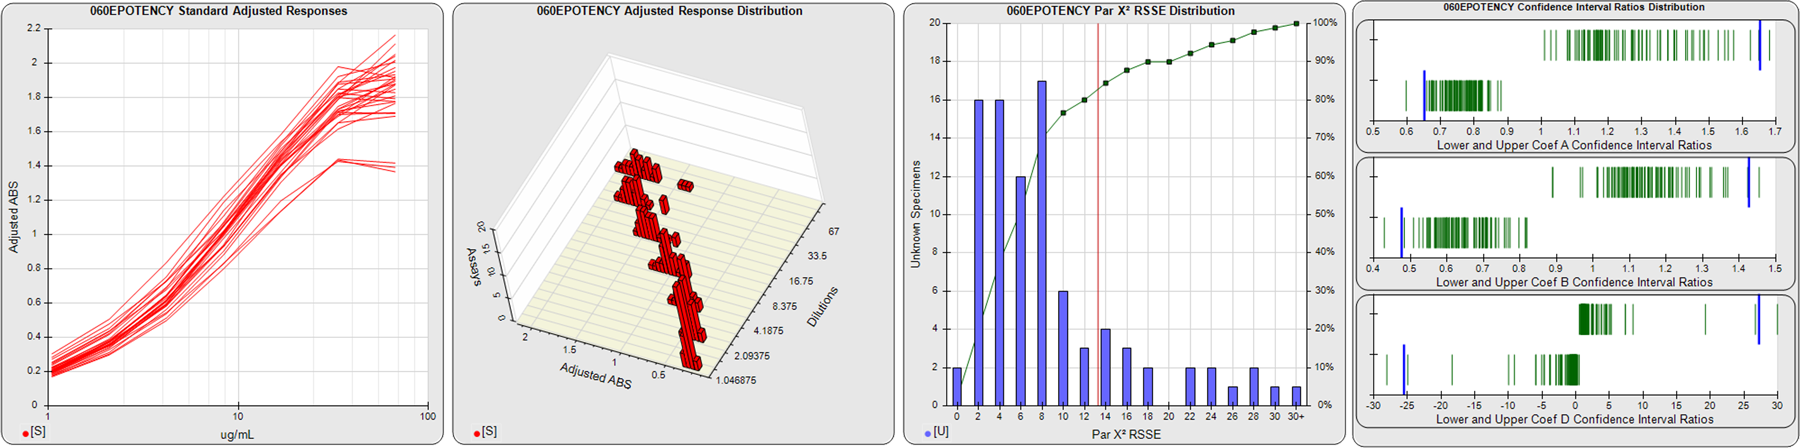
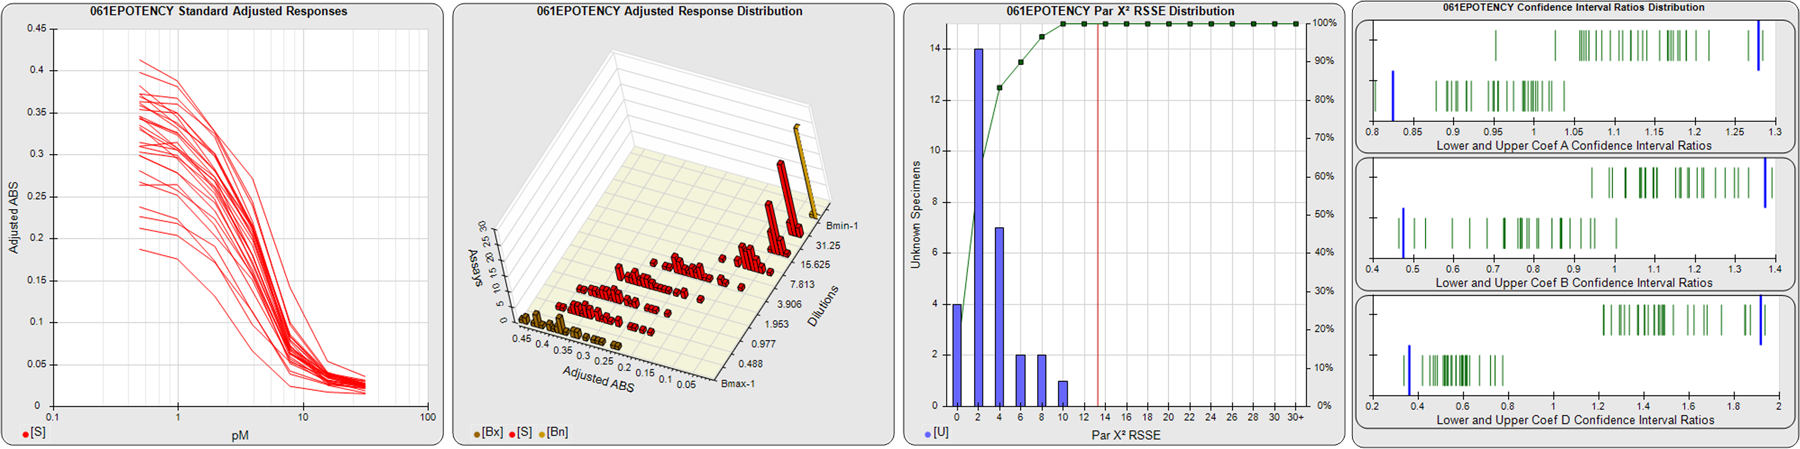
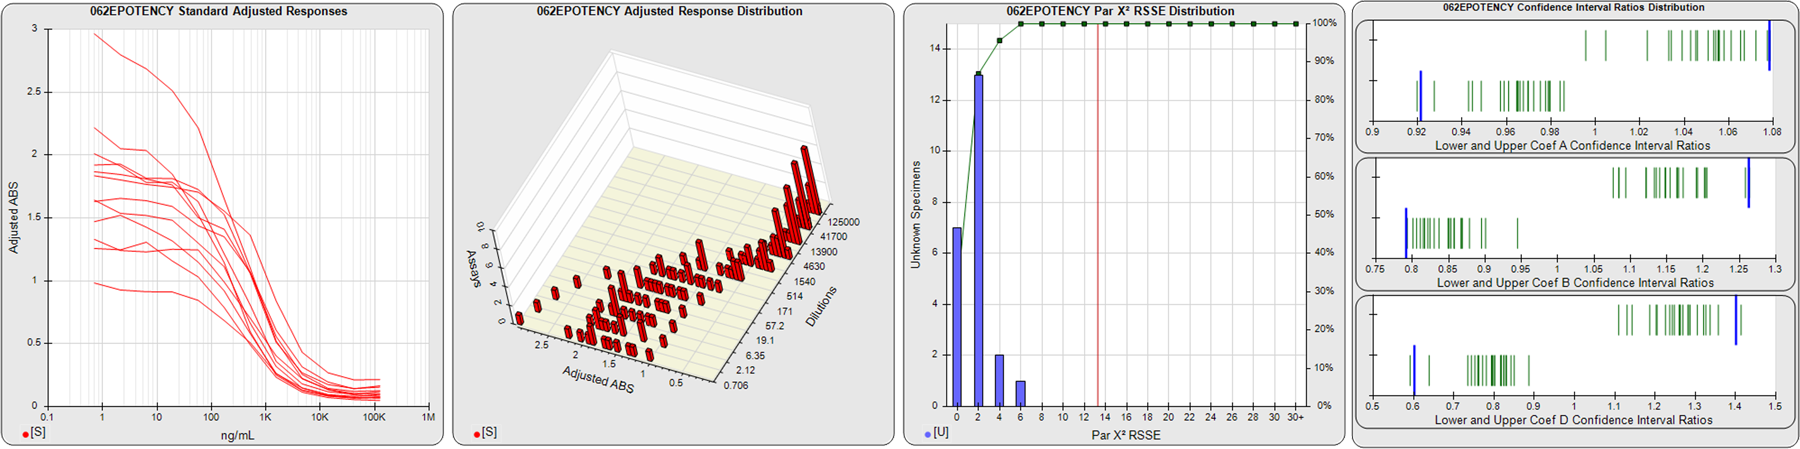
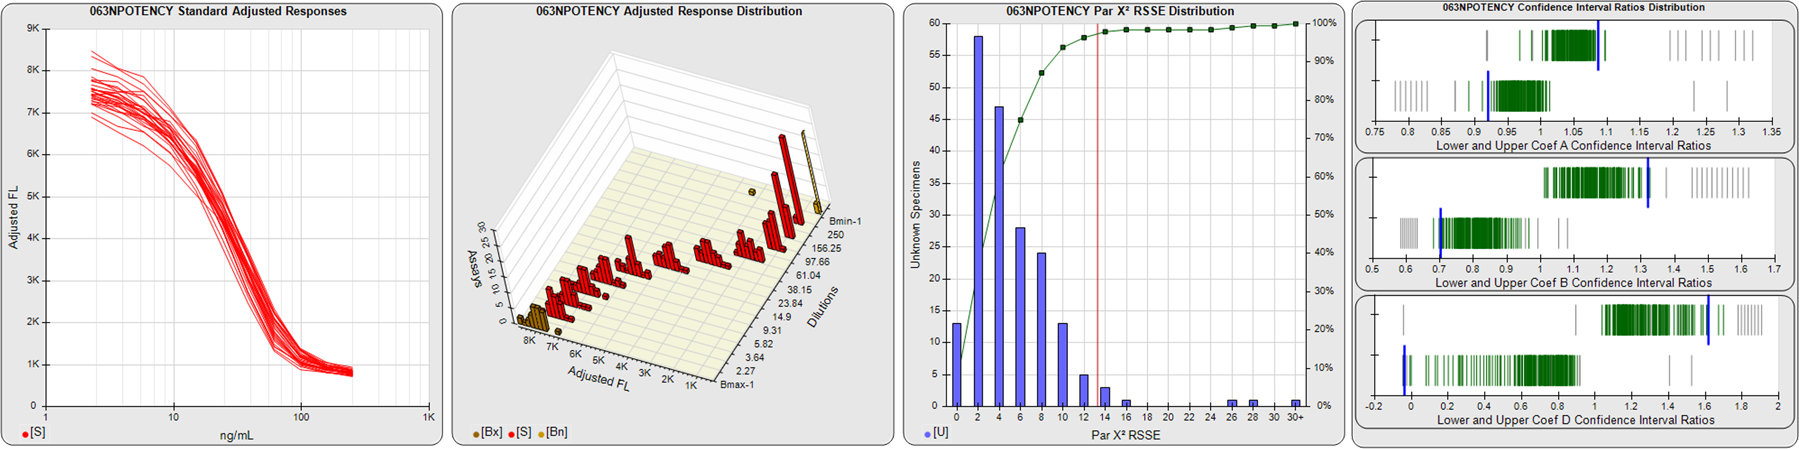
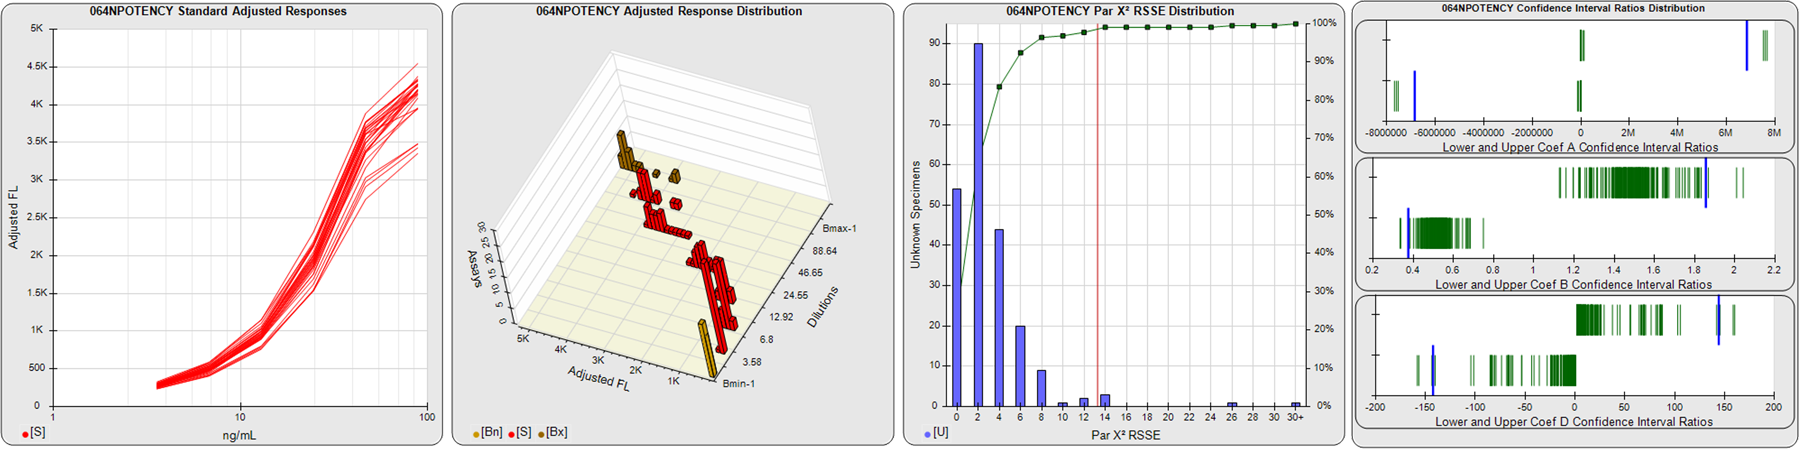
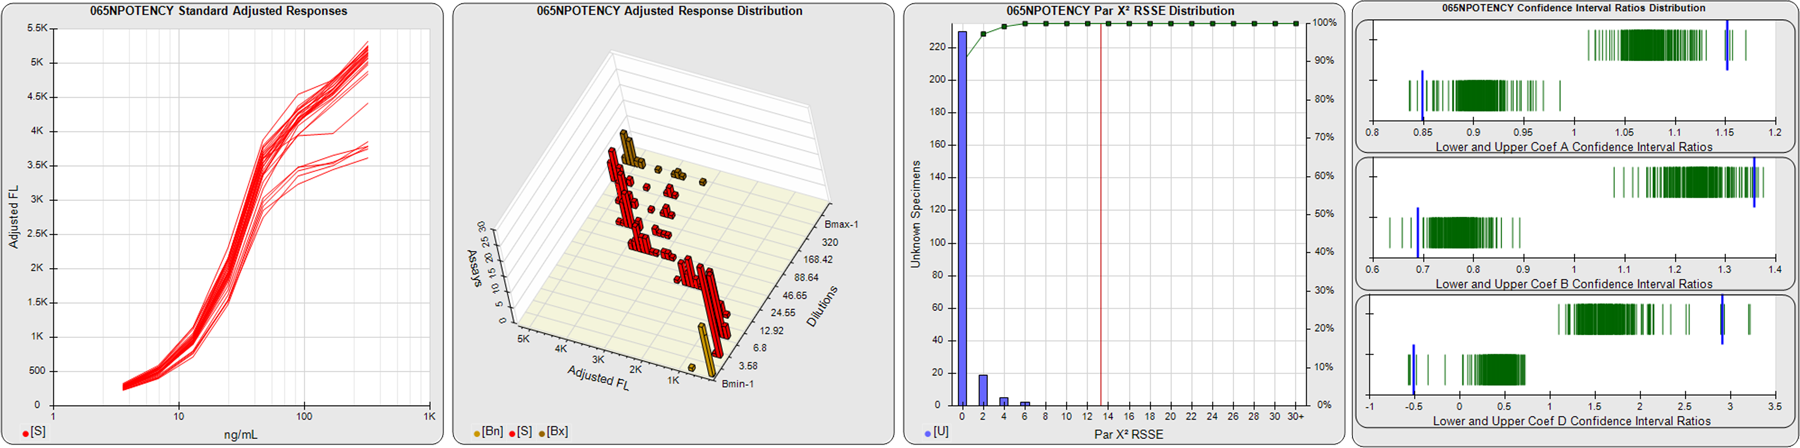
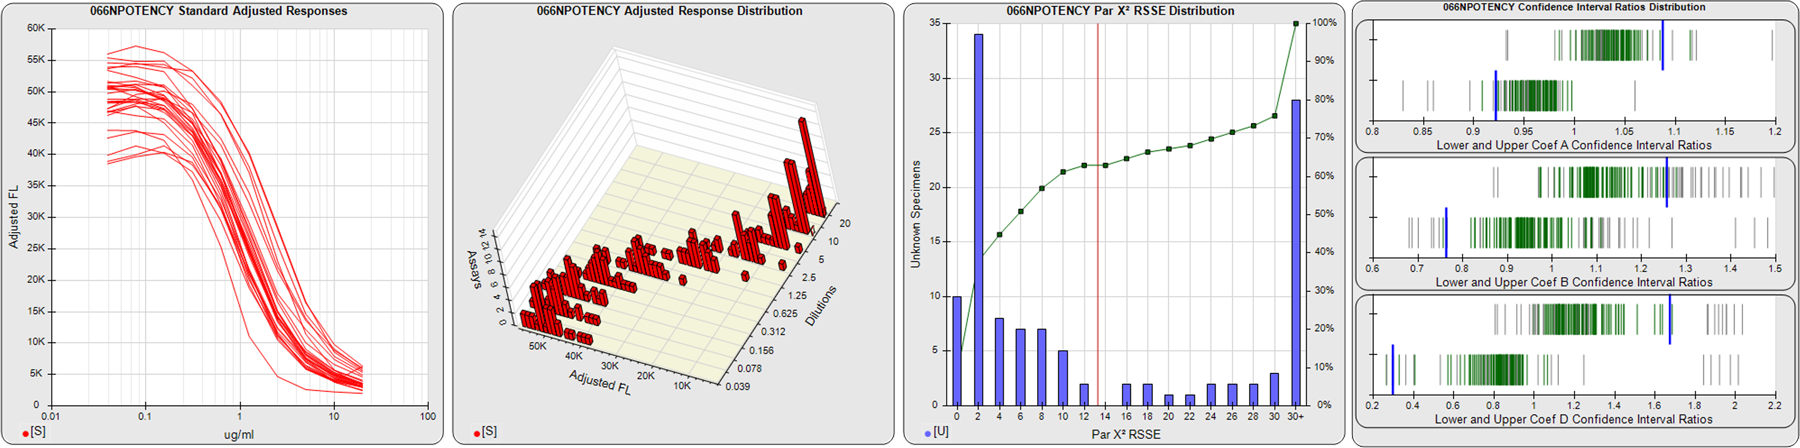
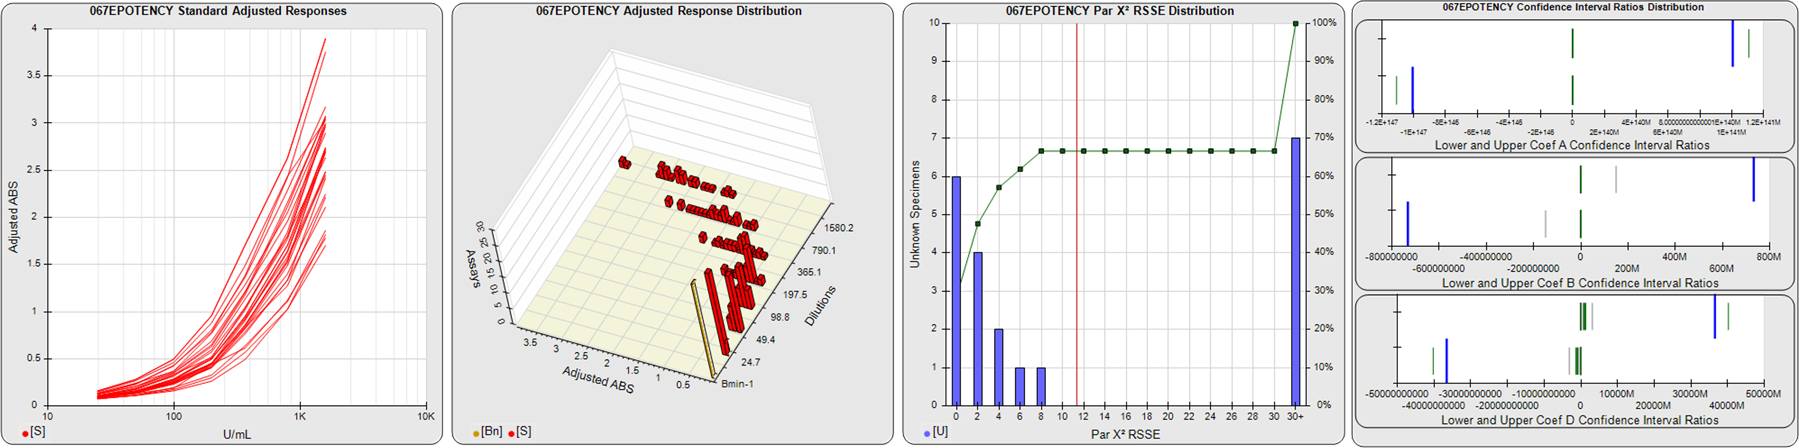
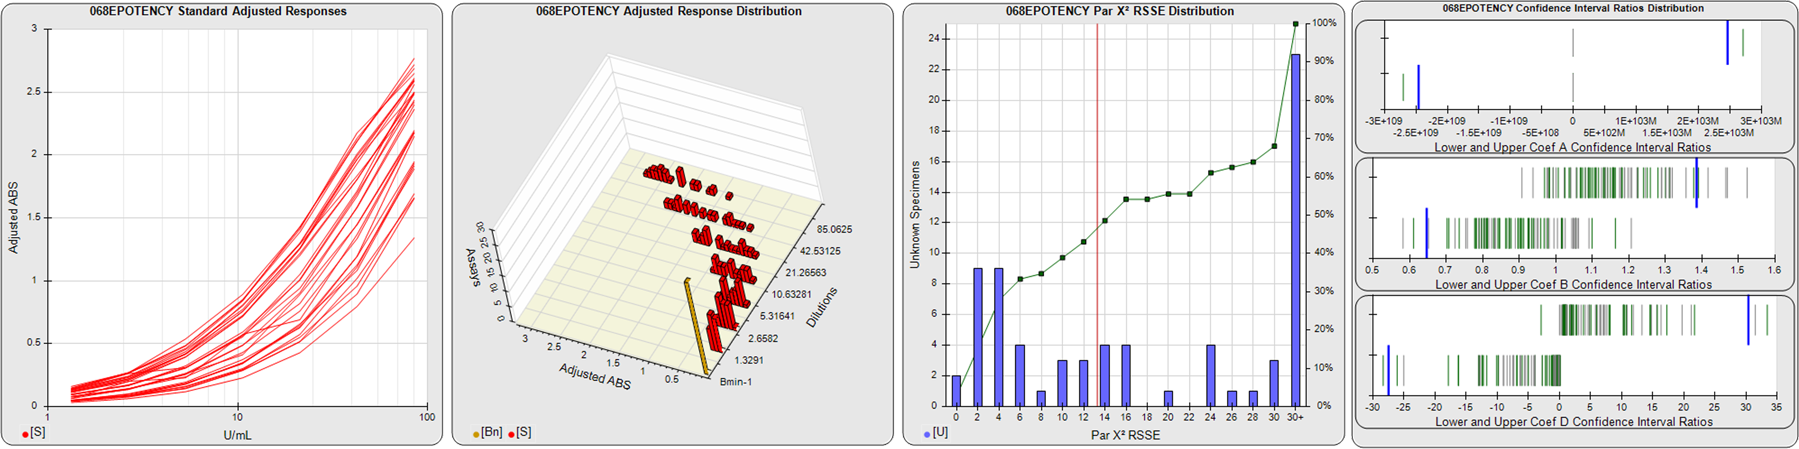
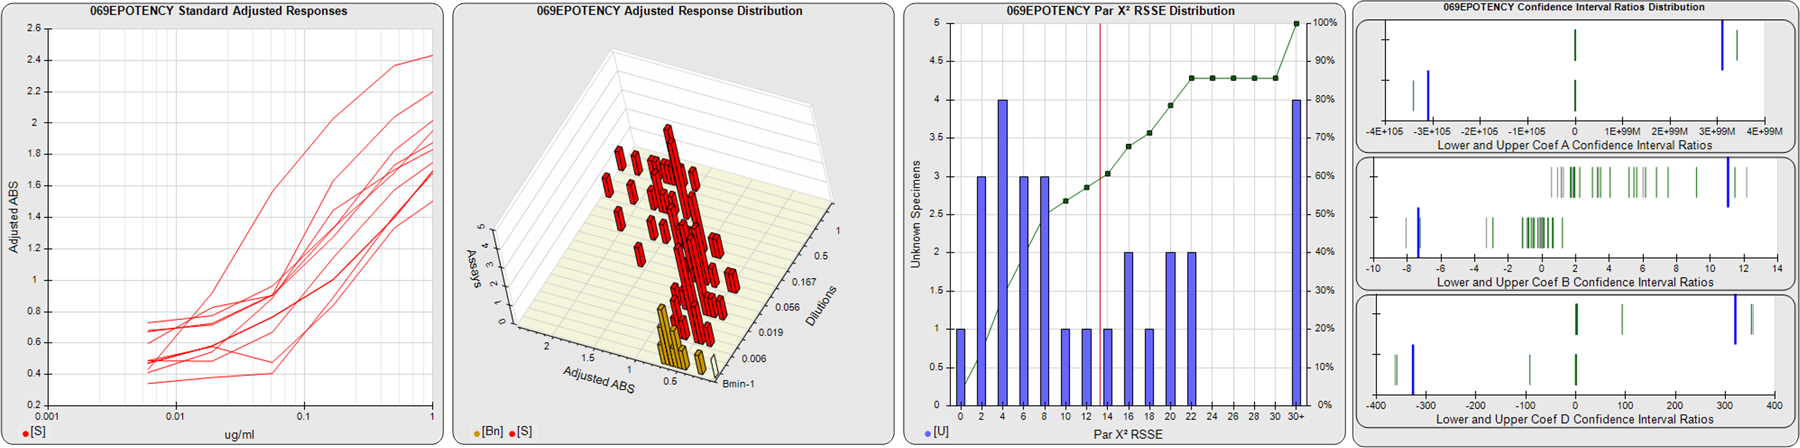
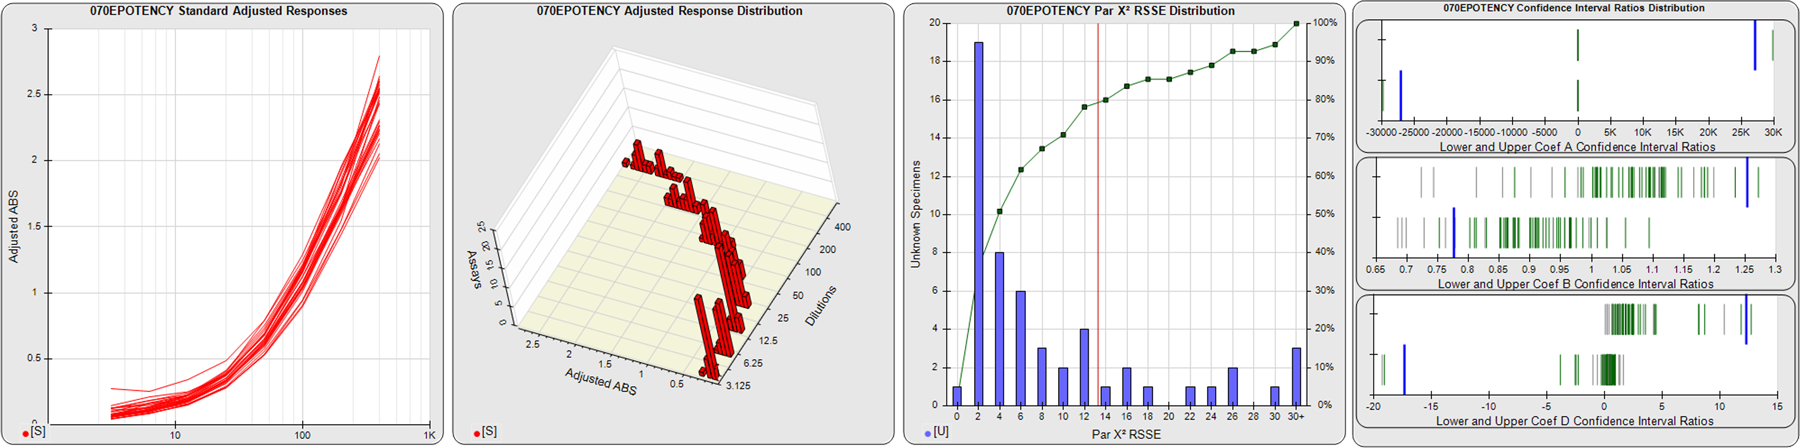
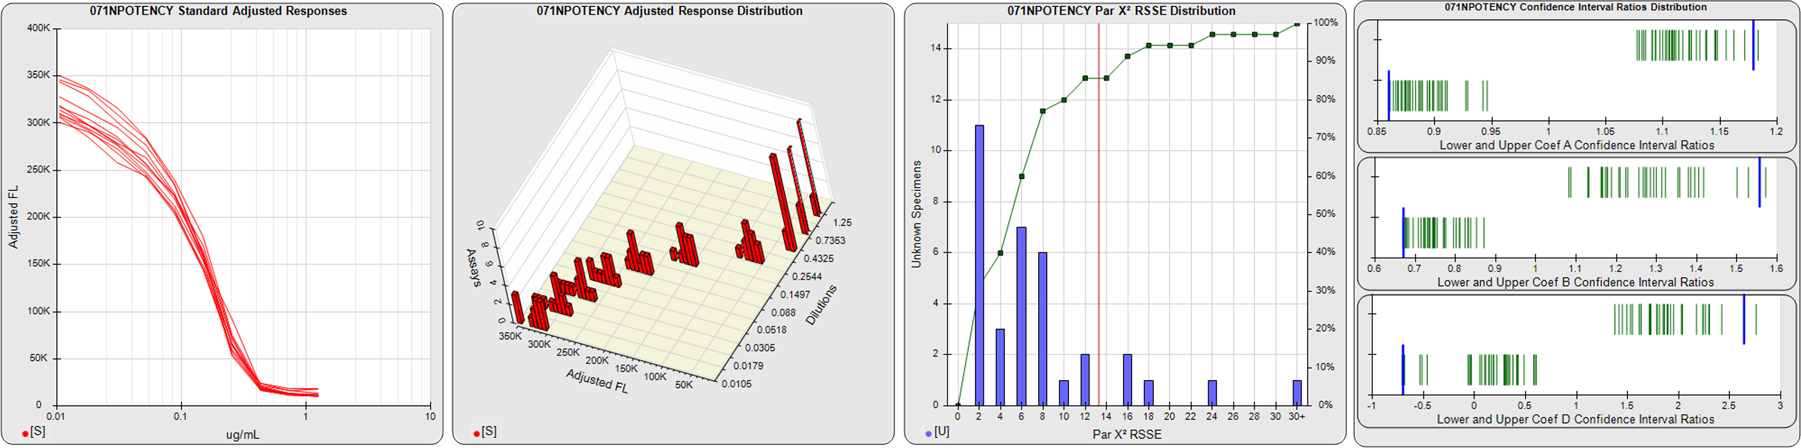
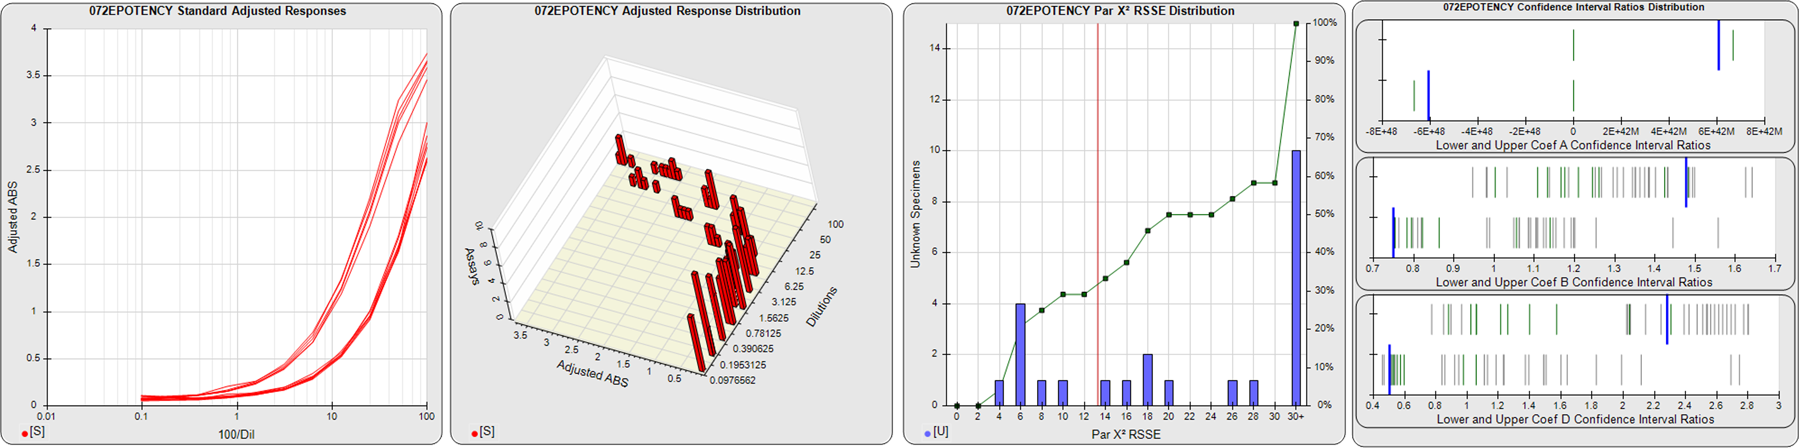
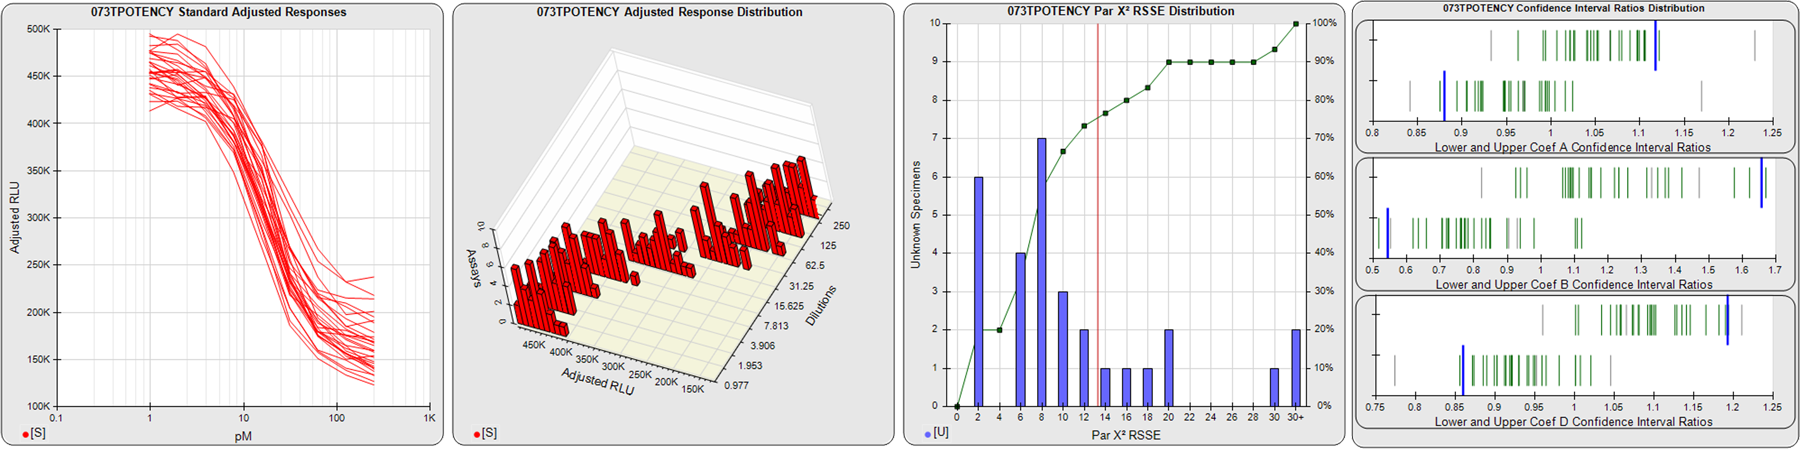
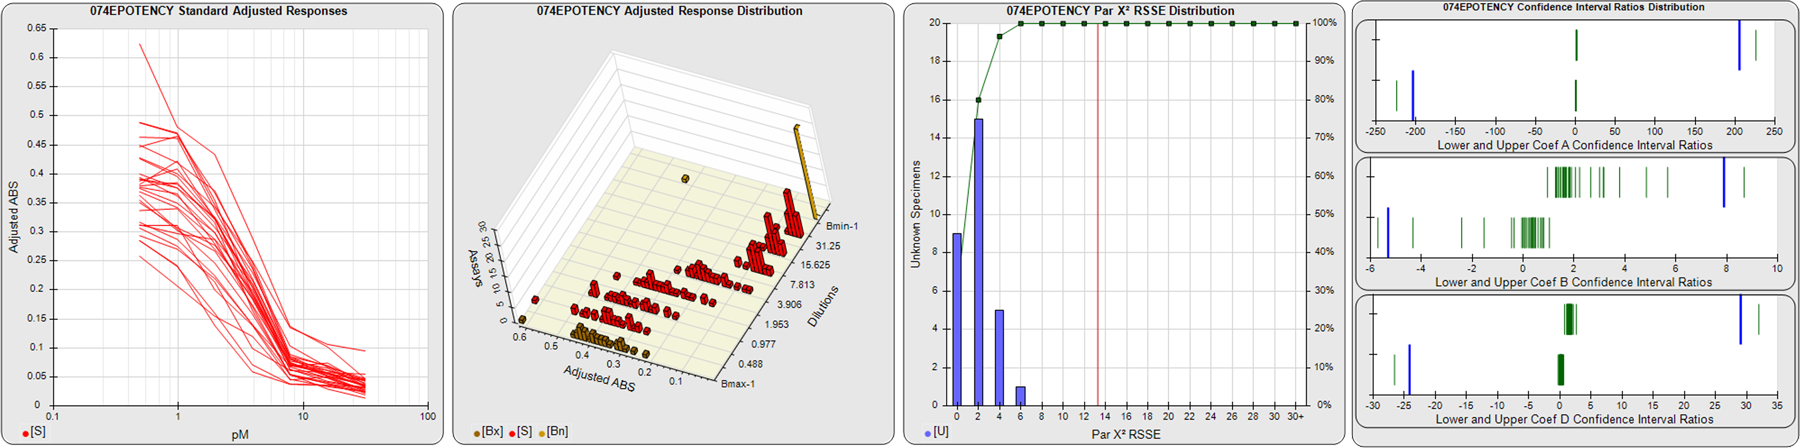
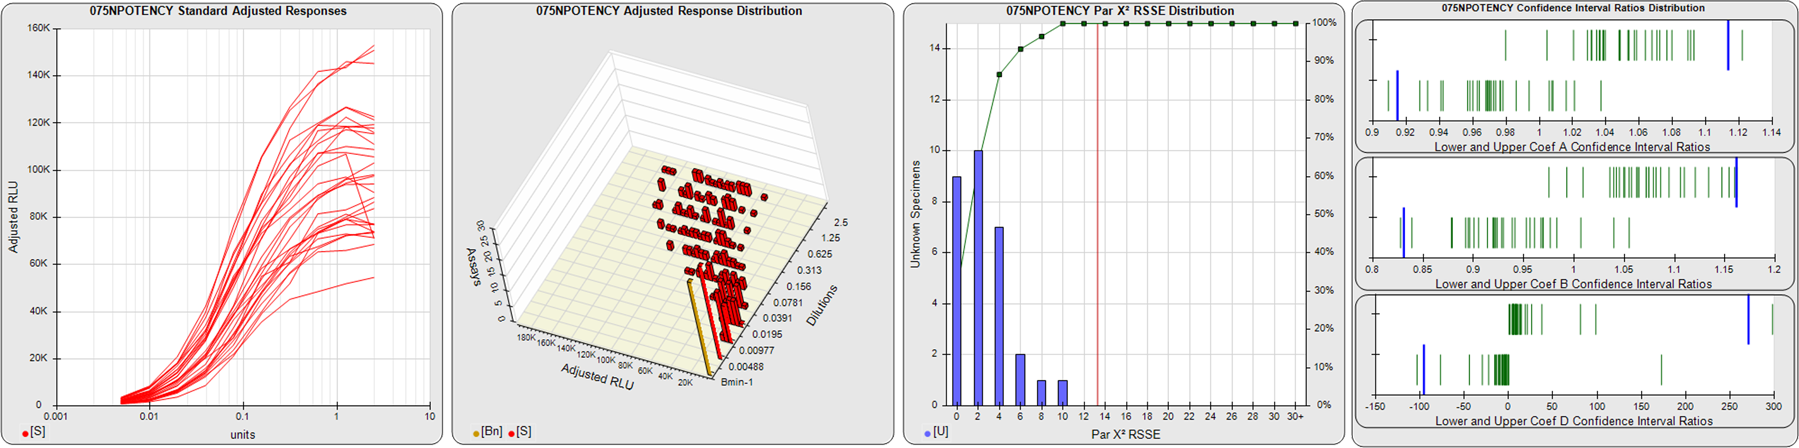
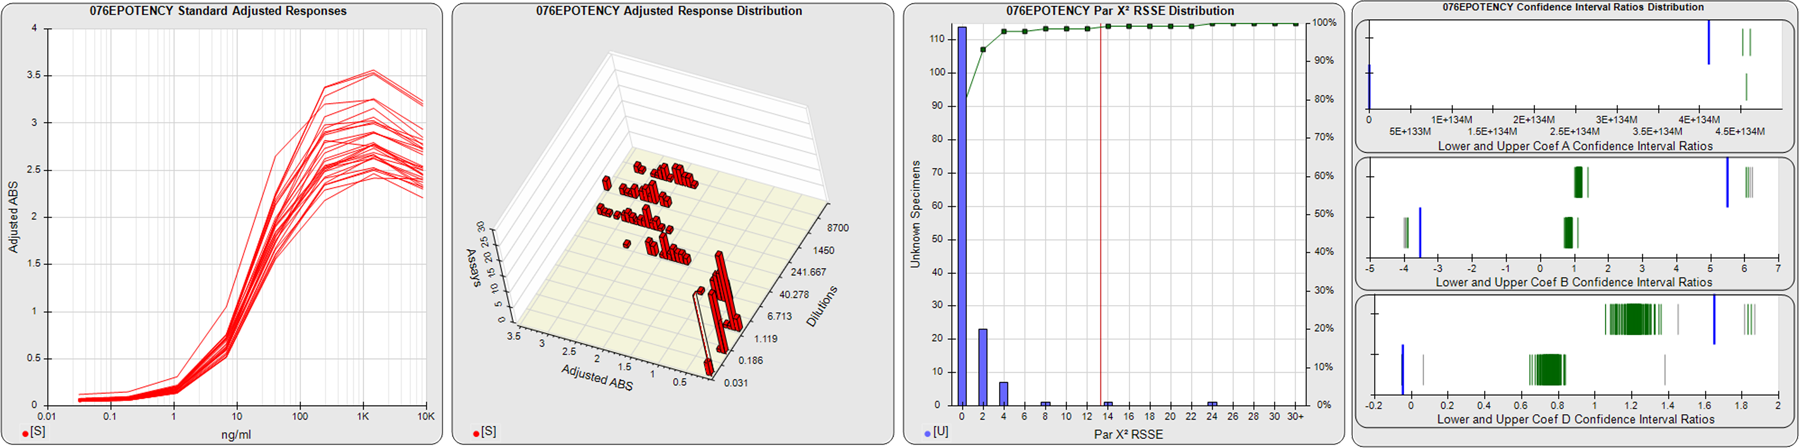
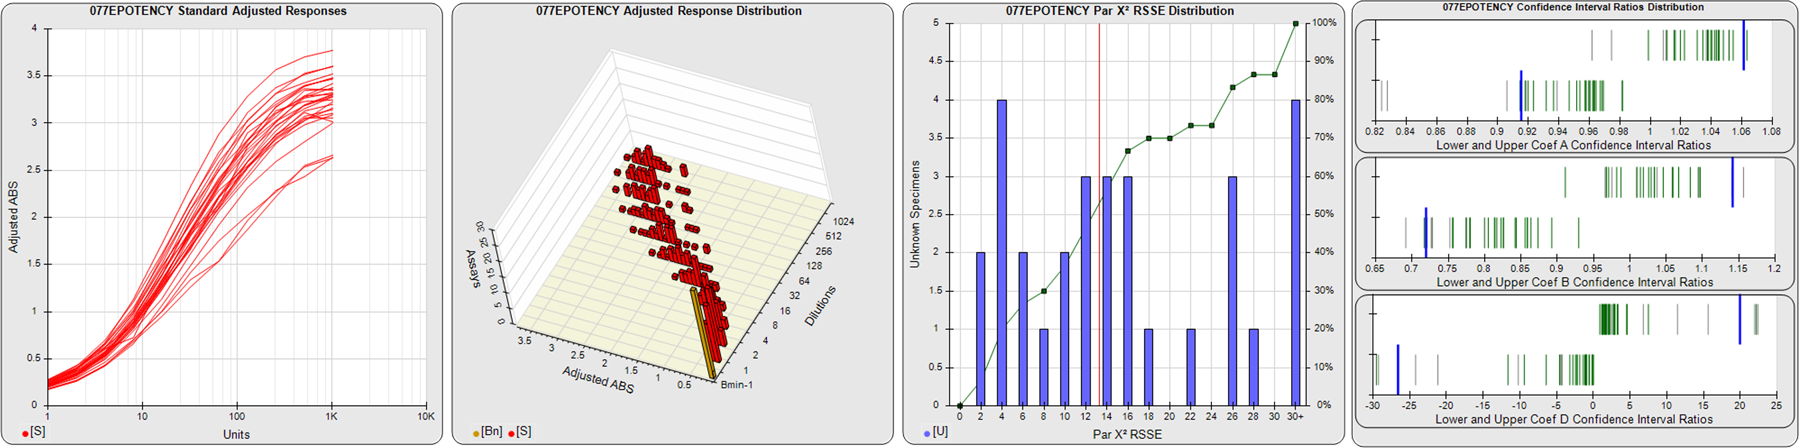
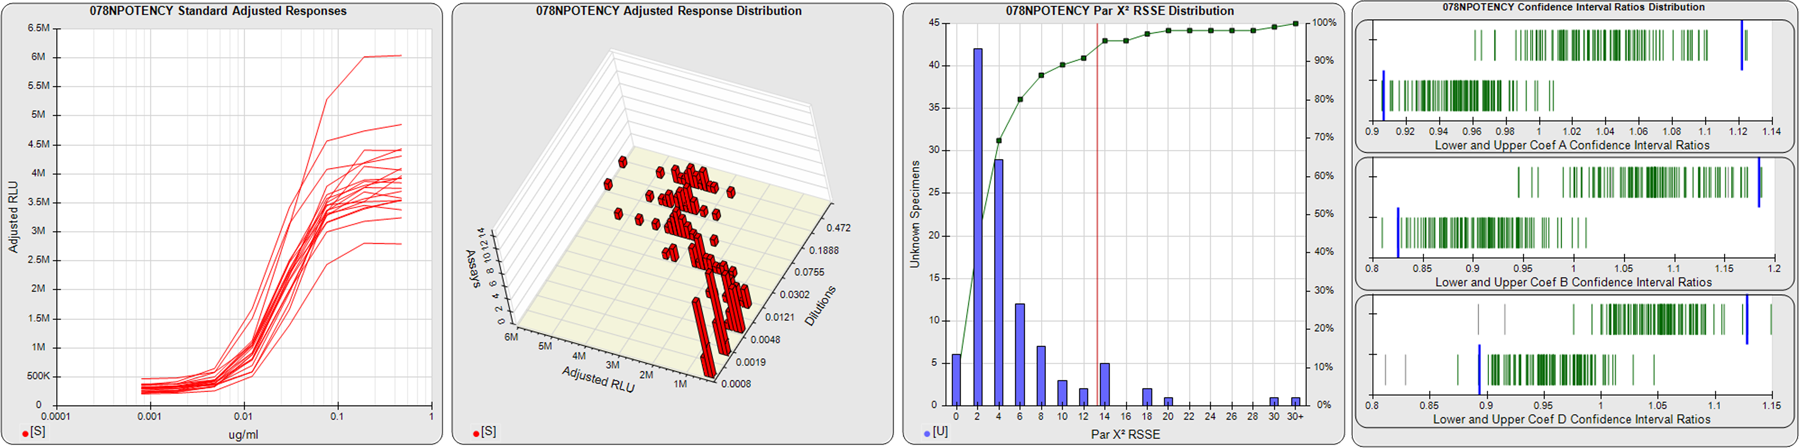
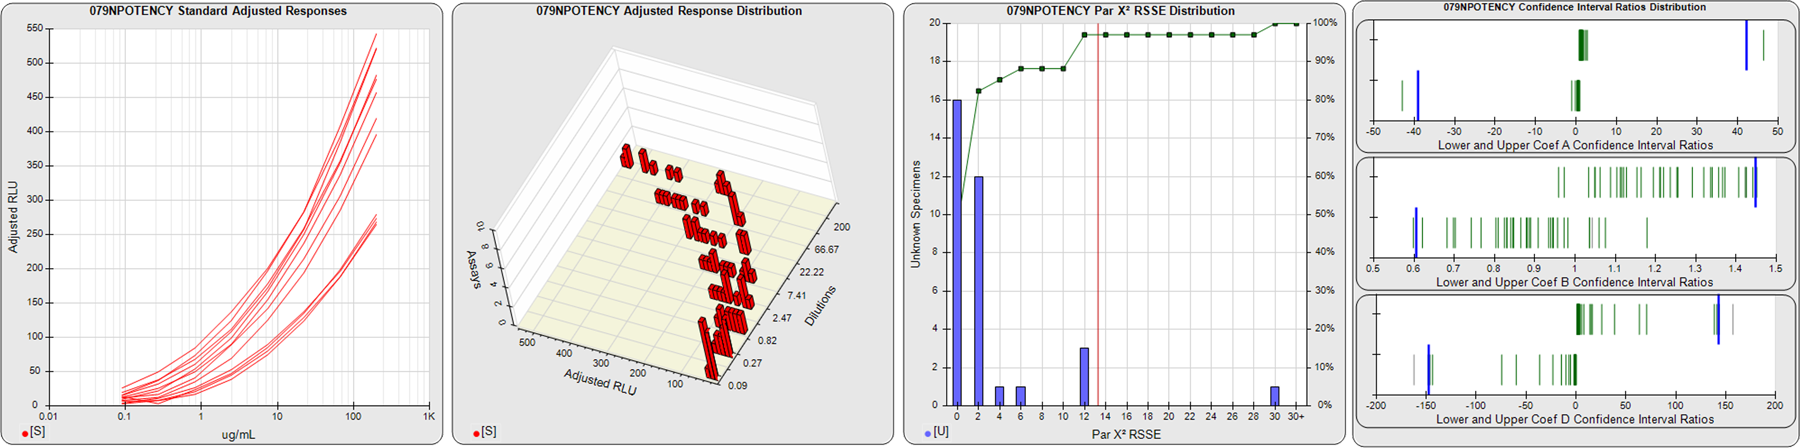
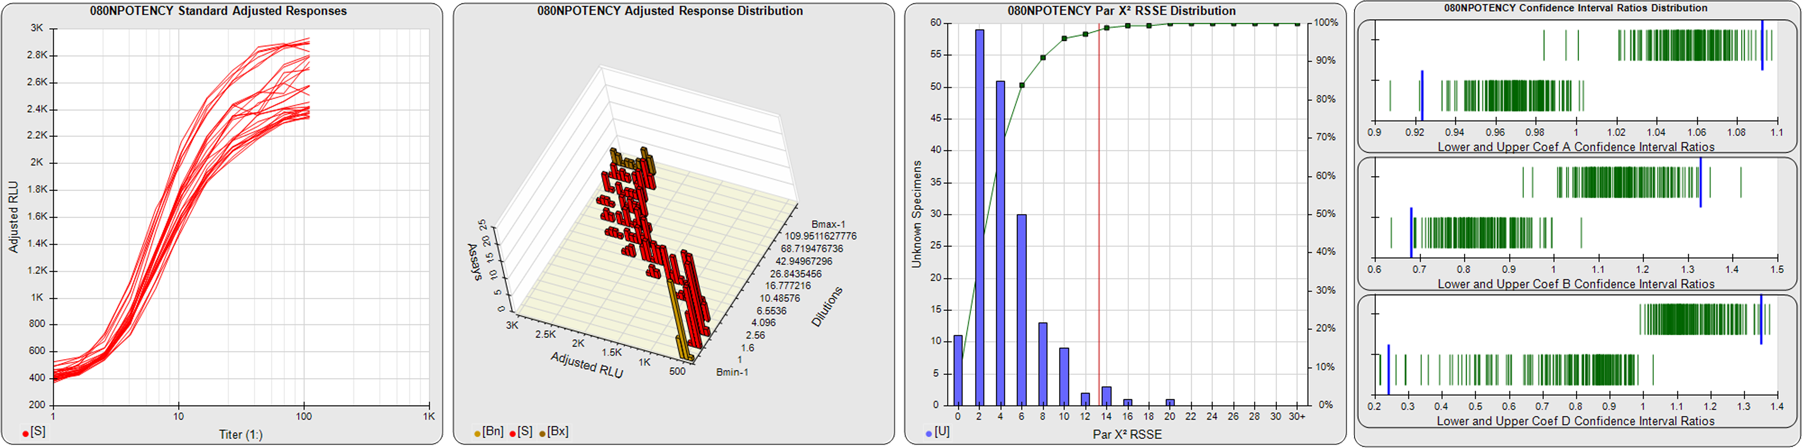
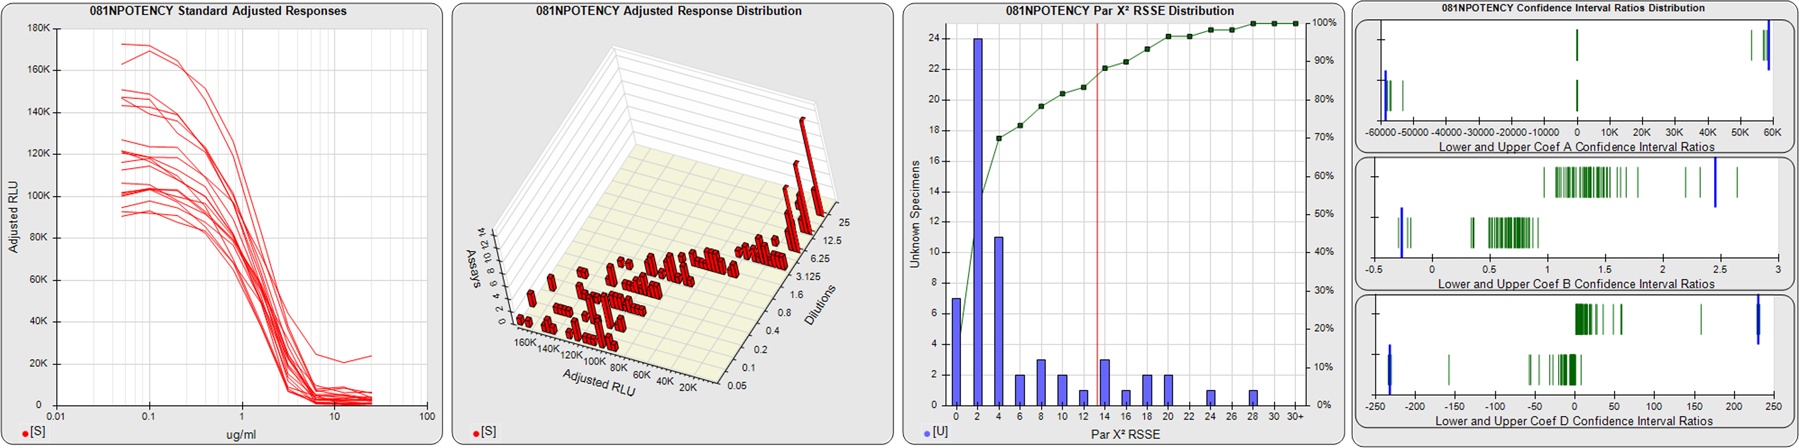
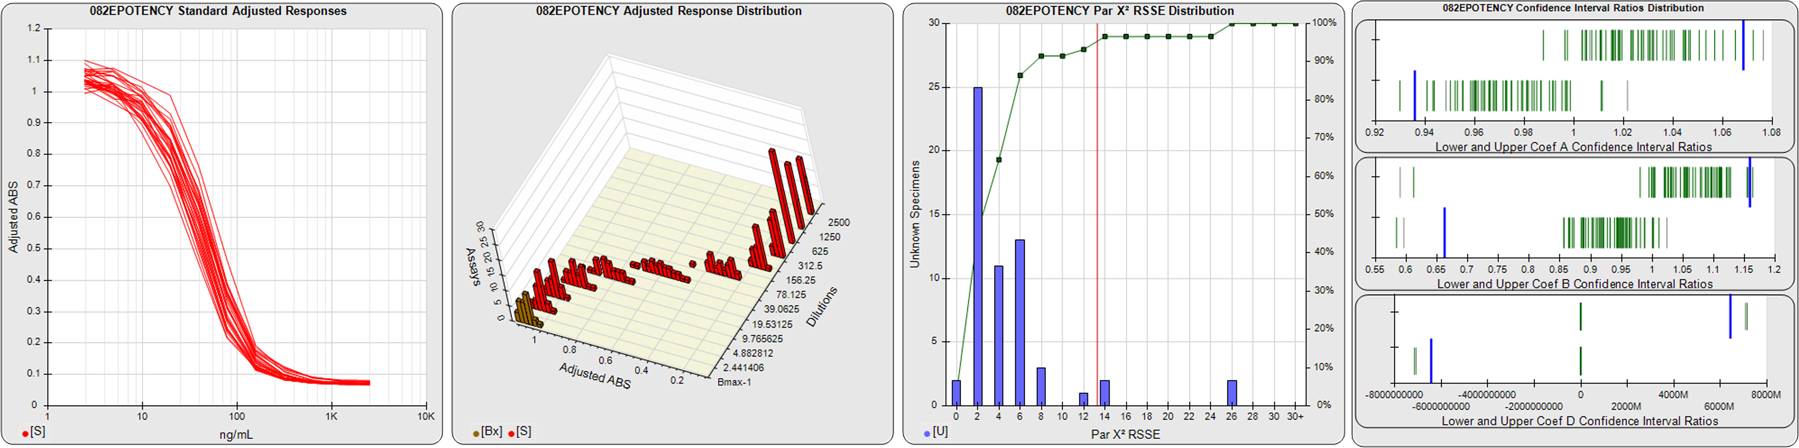
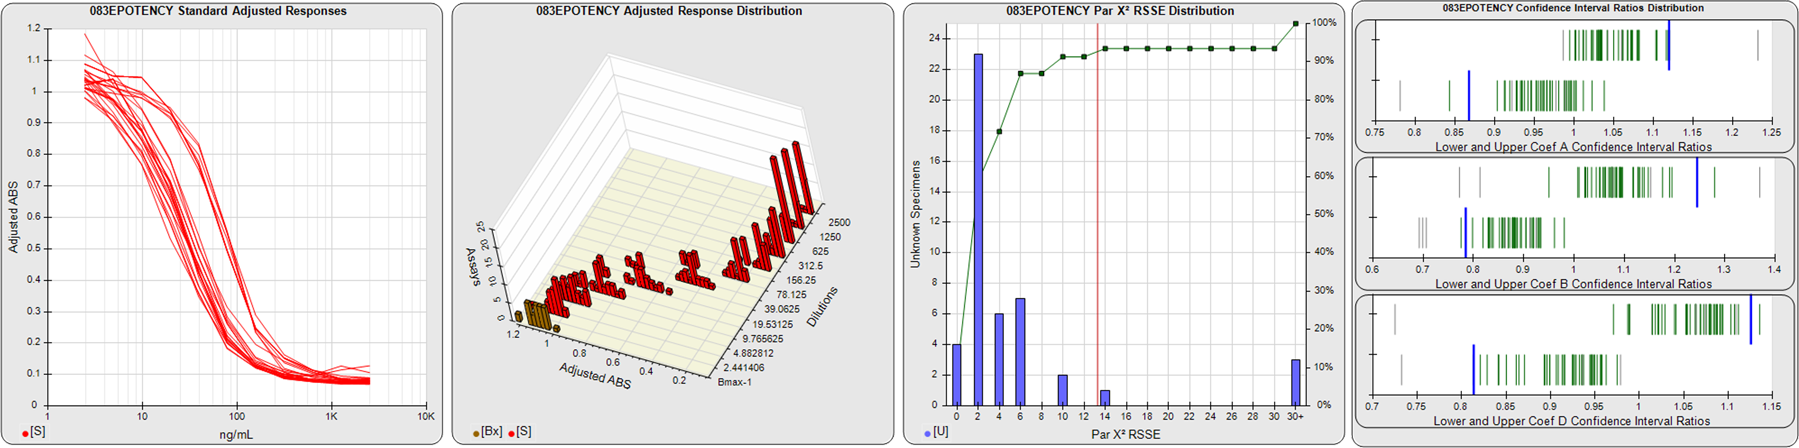
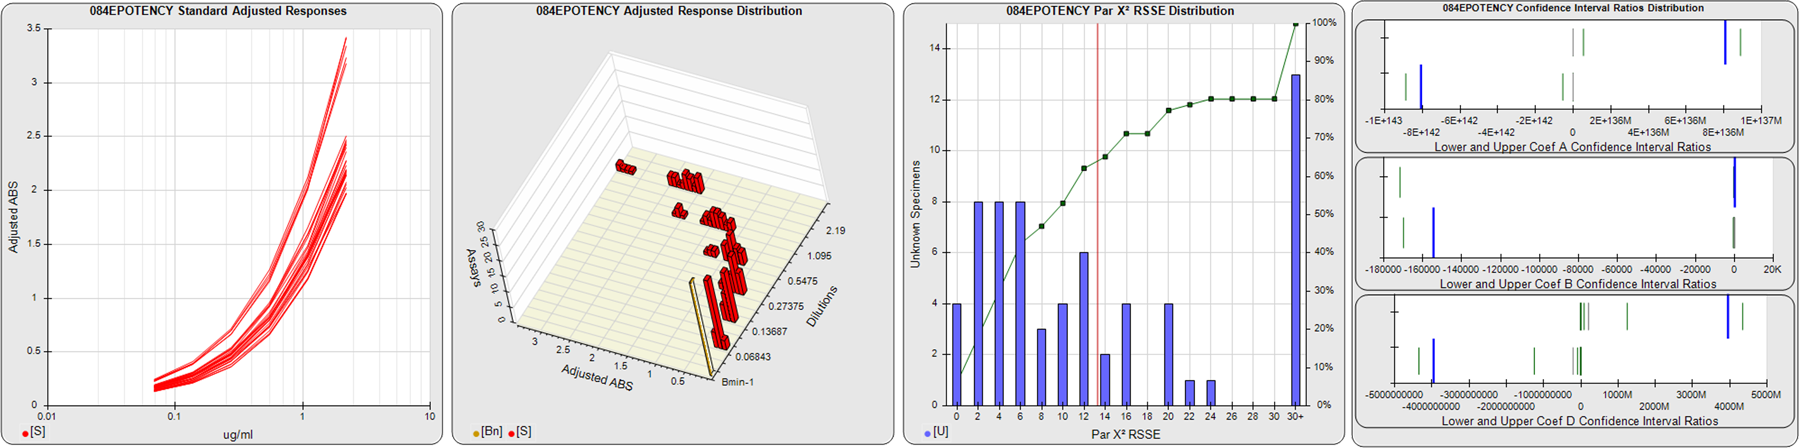
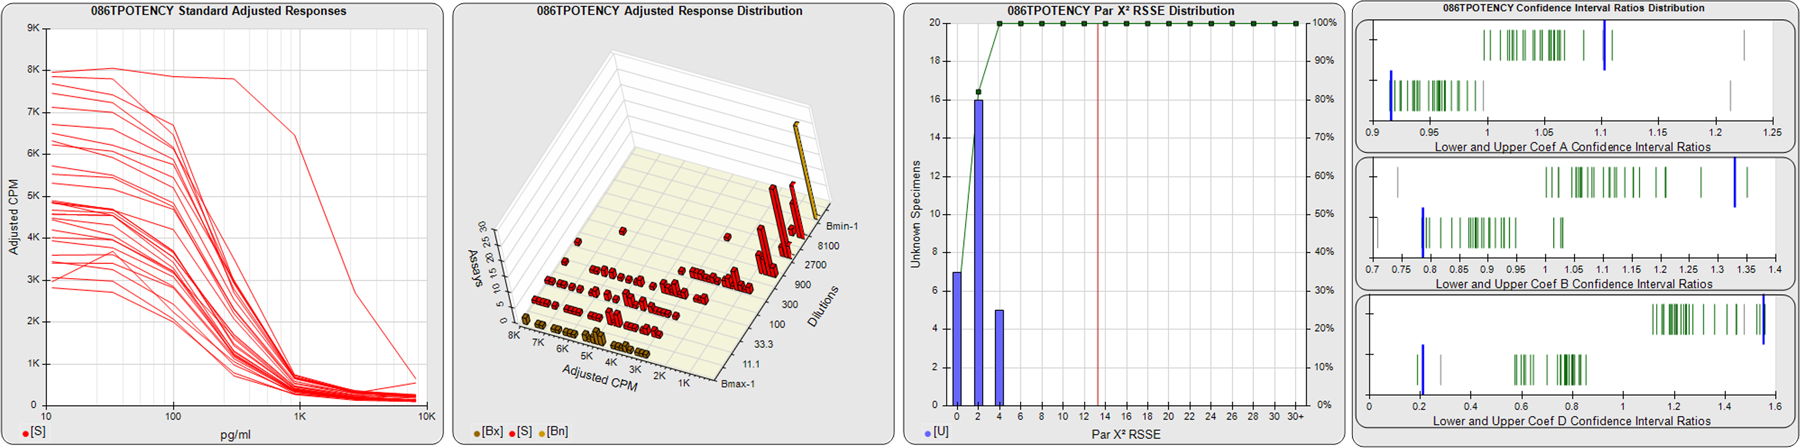
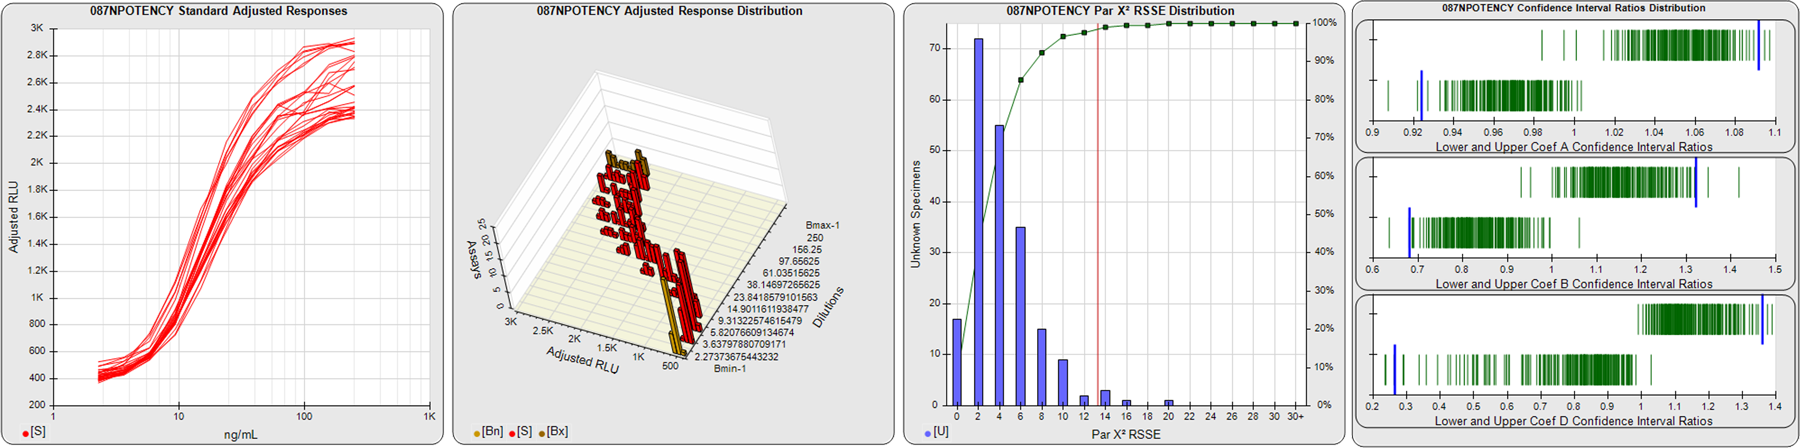
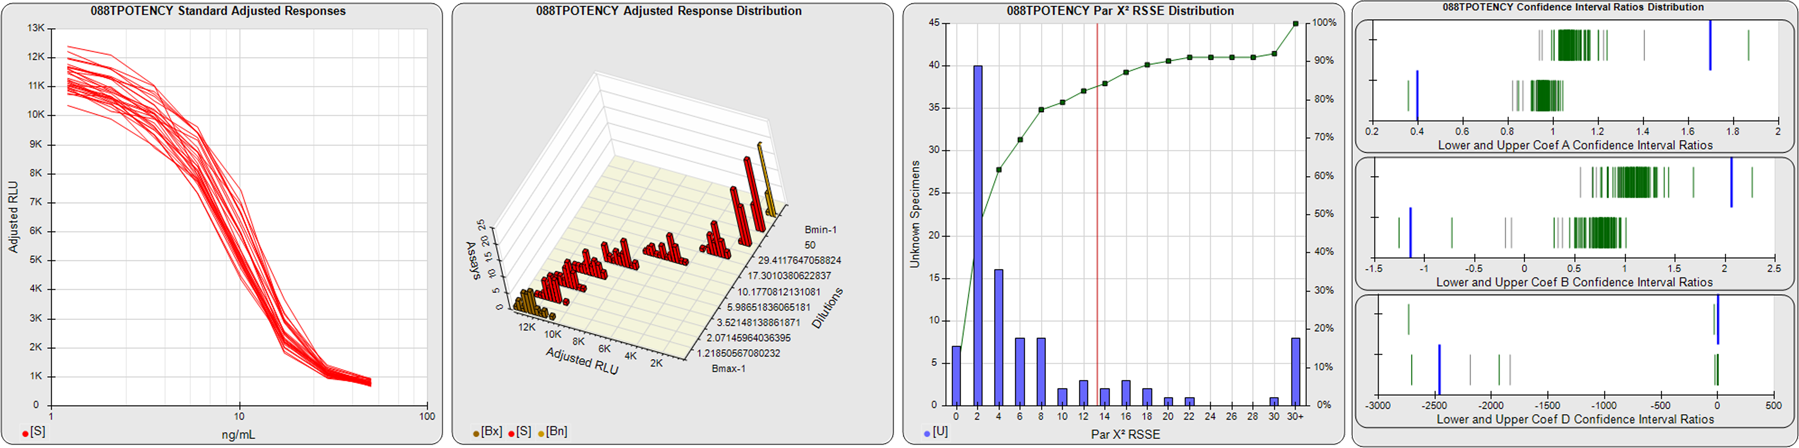
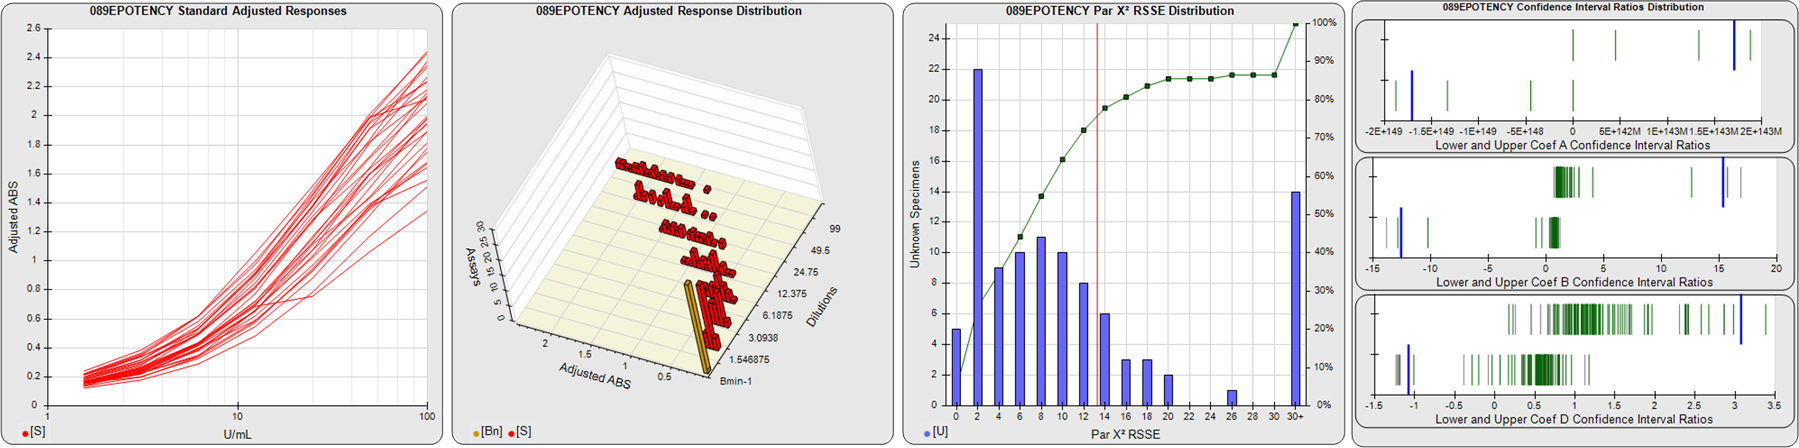
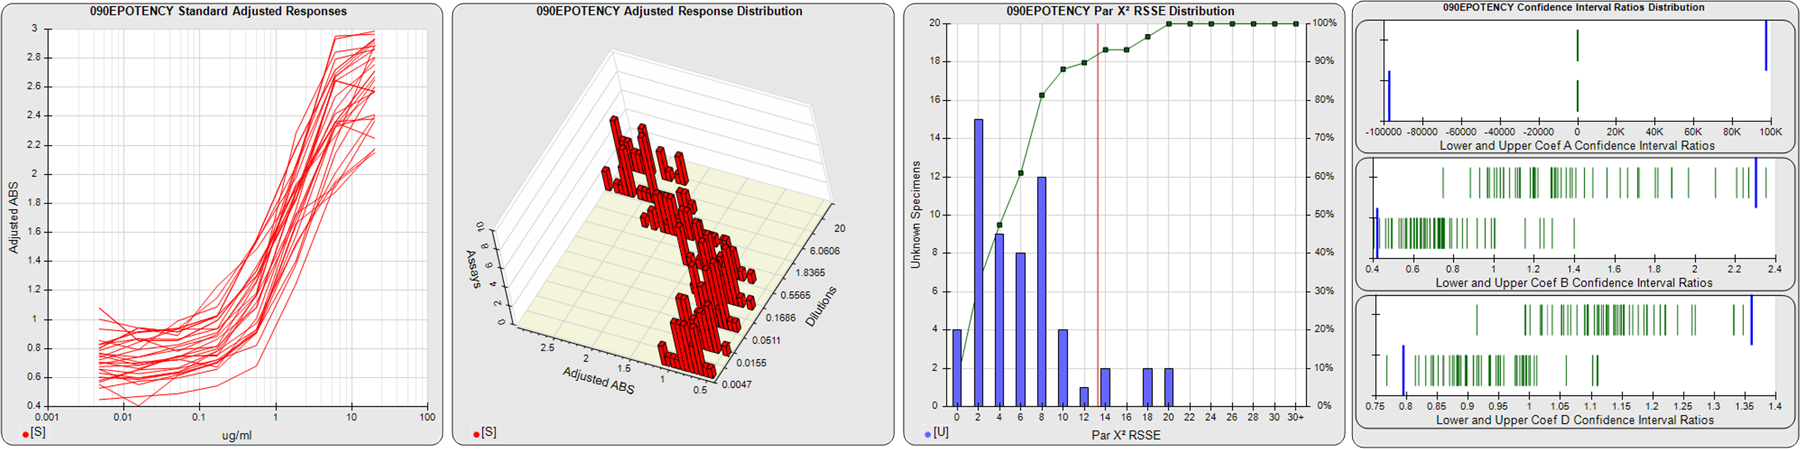
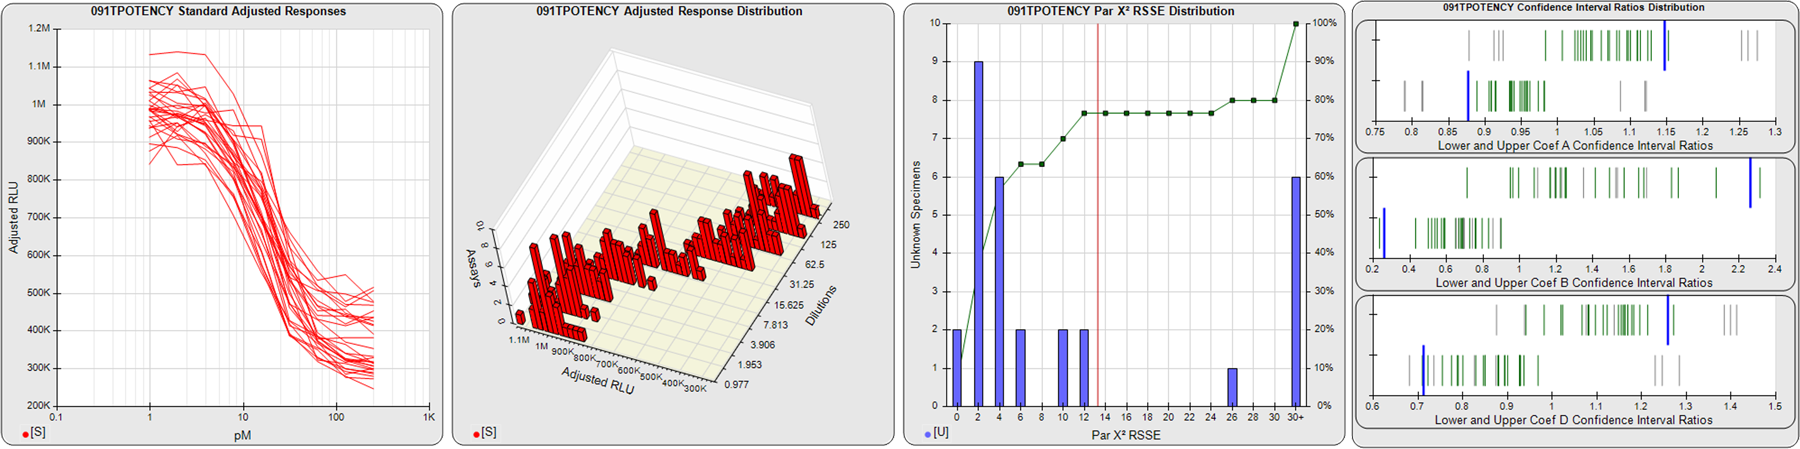
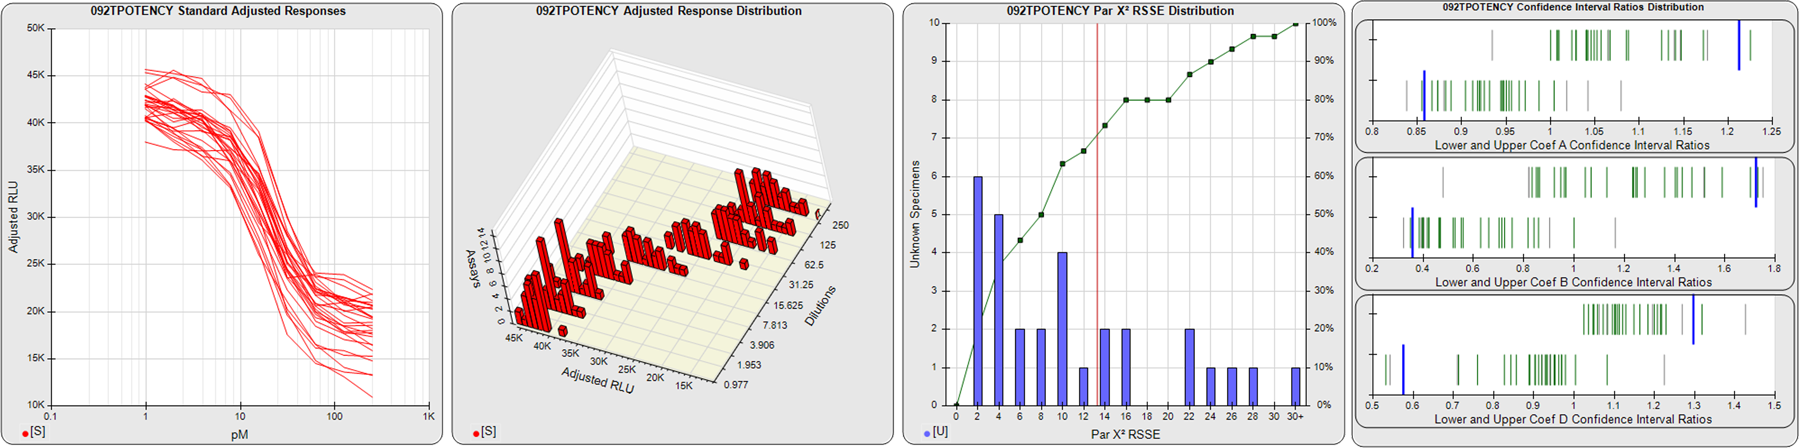
STANDARD DILUTION RESPONSES
The first graph shows the adjusted responses of the linked standard dilutions for each of the pooled assays, adjusted to remove label variation if a tracer was assayed.
STANDARD DILUTION RESPONSE DISTRIBUTIONS
The second graph shows the distribution of adjusted responses from each baseline and standard dilution in the pooled assays in a 3D histogram.
RSSEnonpar PARALLELISM METHOD RSSE DISTRIBUTION
The RSSEnonpar Method (Residual Parallelism) results in a direct measure of the parallelism (similarity) between the reference standard and unknown test sample curves, the weighted nonparallel RSSE (see Tech Note: Curve Weighting). The third graph is a histogram of the magnitude of the nonparallel RSSEs from the unknown test samples in the pooled assays. Unknown test sample results from critically failed standard or unknown curve regressions are excluded. The red line is plotted at a chi-square probability threshold of 0.01 for the nonparallel RSSEs. The cumulative percentage at each nonparallel RSSE level is plotted on the right axis in green.
EQUIVALENCE PARALLELISM METHOD UPPER AND LOWER RATIO DELTA DISTRIBUTION
The Equivalence Method (Confidence Interval Parallelism) is a measure of the ratio (or difference) deltas of the lower and upper confidence interval limits of the Unknown / Standard curve coefficients. Confidence intervals at 0.9 significance were determined using the Monte Carlo Method, which is more stable and precise than linear approximation or profile method estimates (see the Tech Note: Monte Carlo Method). The fourth graph shows deltas of the upper (top) and lower (bottom) confidence interval limit ratios plotted as green vertical lines for the 4PL a, b, and d coefficients of the pooled assays. Gray lines are confidence interval limit ratio deltas from critically failed standard or unknown curve regressions or critically failed parallelism determinations. The upper and lower goalpost borders, plotted as blue vertical lines, were computed at the 99th percentile of the respective pooled assay ratio deltas after excluding failed deltas.