Potency Curve Dilutions for Test 046NPotency
Optimization of Curve Dilution Concentrations for Relative Potency Test 46NPOTENCY
Question
What are the optimal dilution concentrations to use with the potency test 046NPOTENCY (test name and other identifying information have been changed)?
Analysis
ALL DILUTIONS INCLUDED
A 20-assay pool with 57 unknown test samples between them were computed with 5PL RSSEnonpar Method (Residual Parallelism) and 4PL Equivalence Method (Confidence Interval Parallelism). The initial series had 8 dilutions with a 6:1 step factor each from 0.00107 – 300 nM. The metrics and graphs presented here are from STATLIA MATRIX’s Performance Analysis reports.
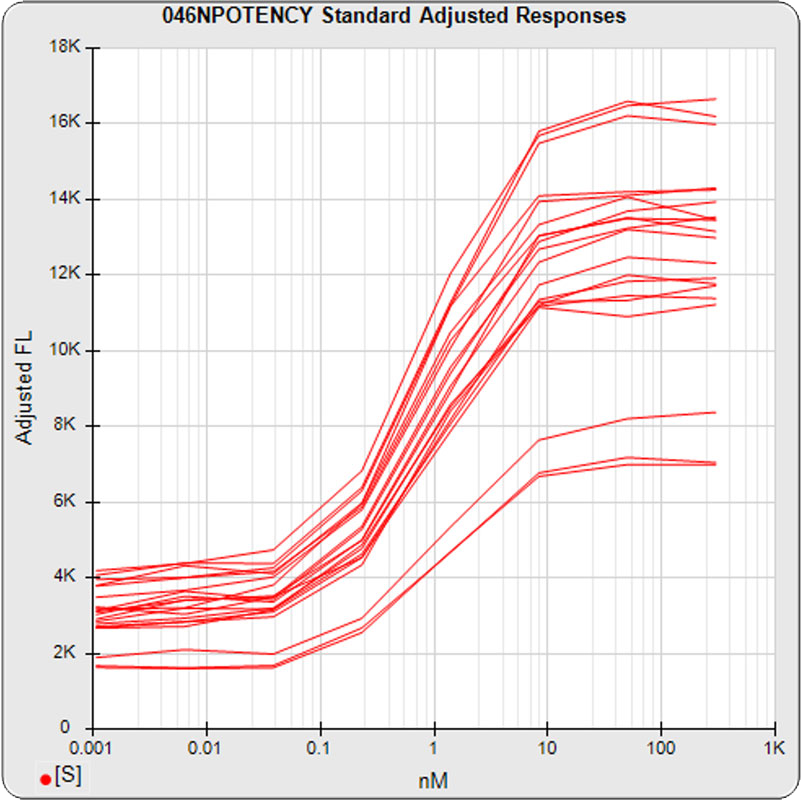
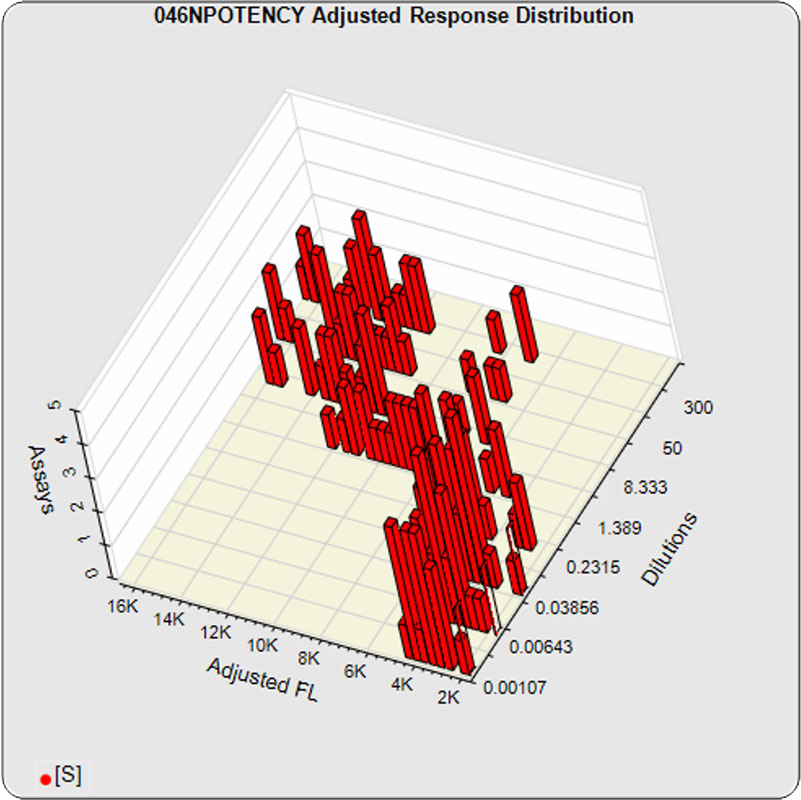
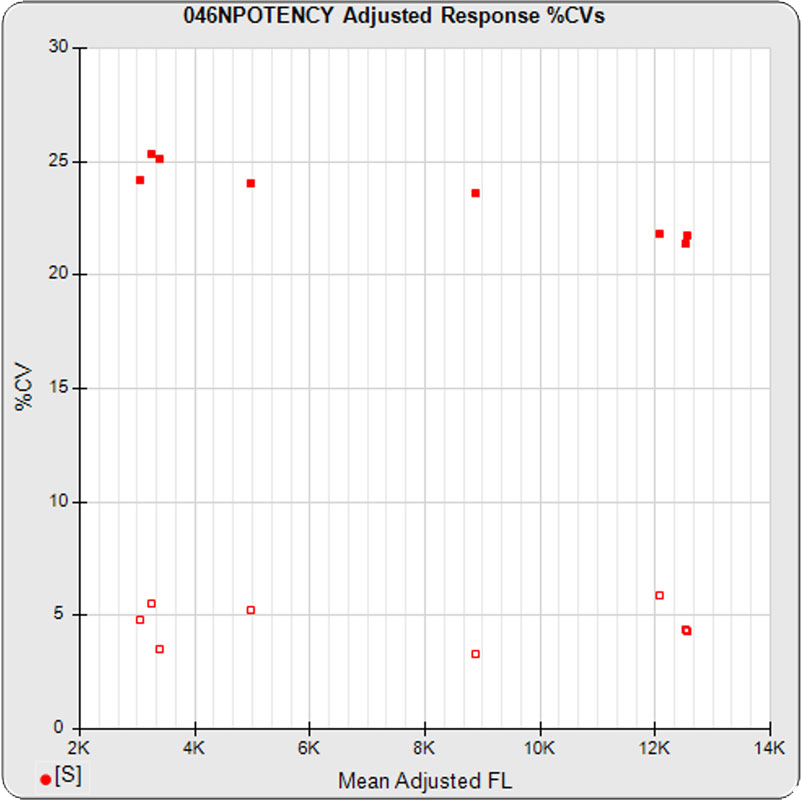
The linked standard adjusted responses (left graph) and standard dilution response distributions (center graph) show a hook at many of the high dilutions and a saturated response plateau at the lowest dilutions. The inter-assay %CV of the dilutions (right graph, solid squares) are stable for all of the dilutions, indicating no excess noise in the endmost
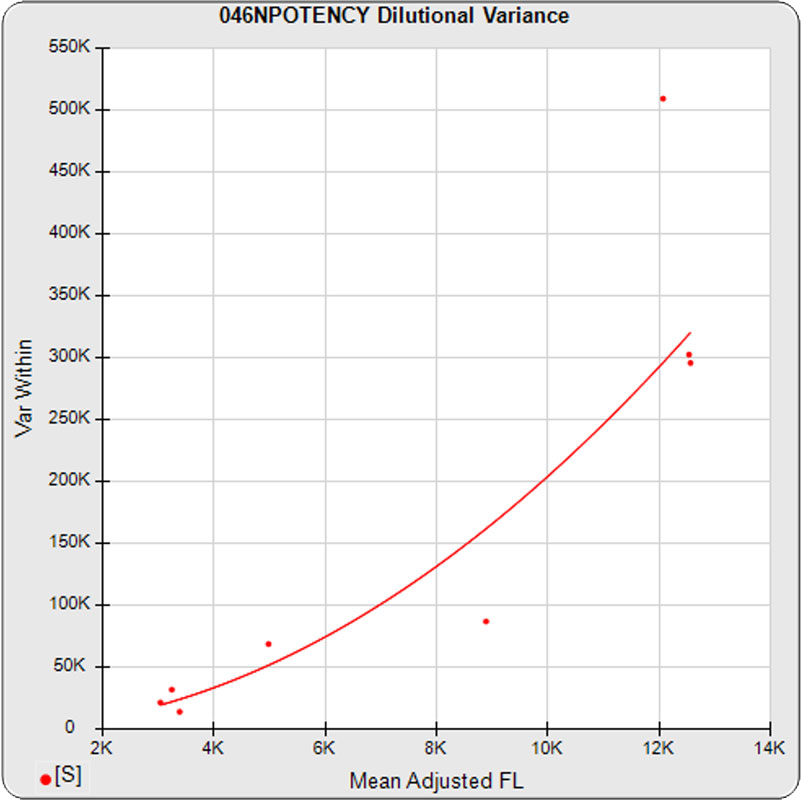
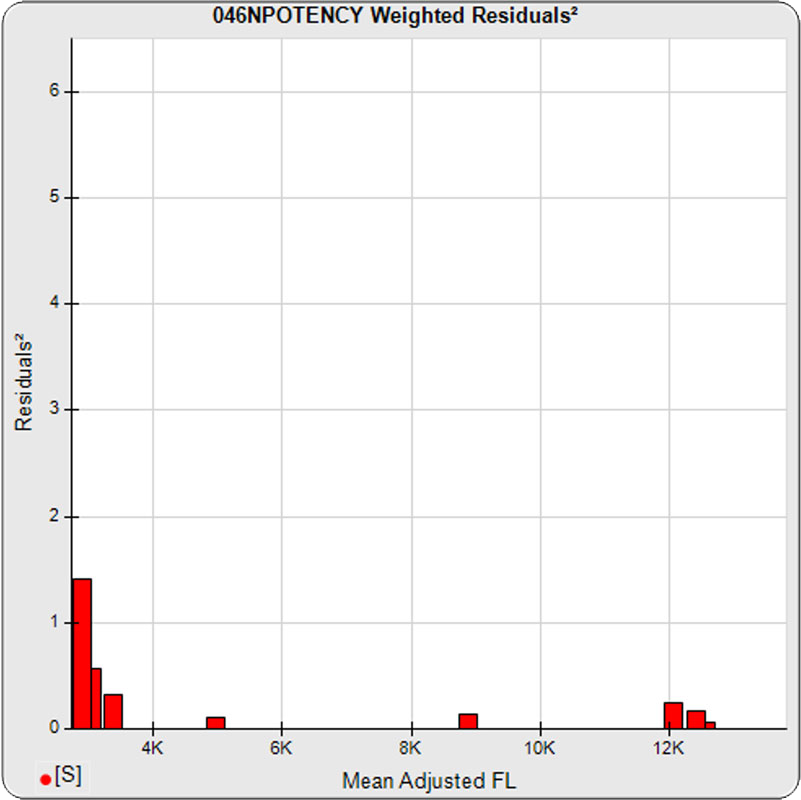
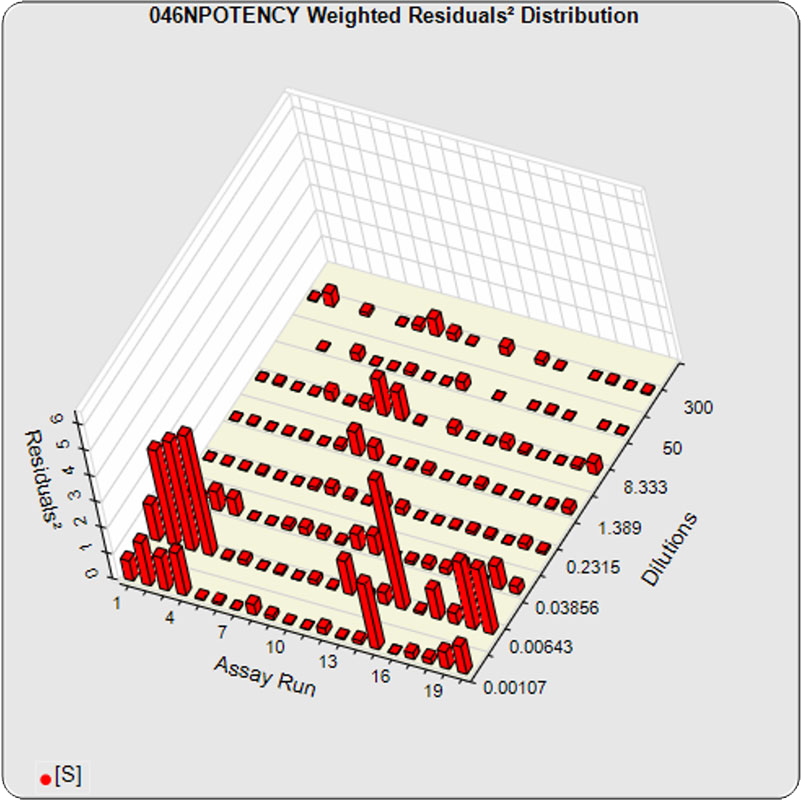
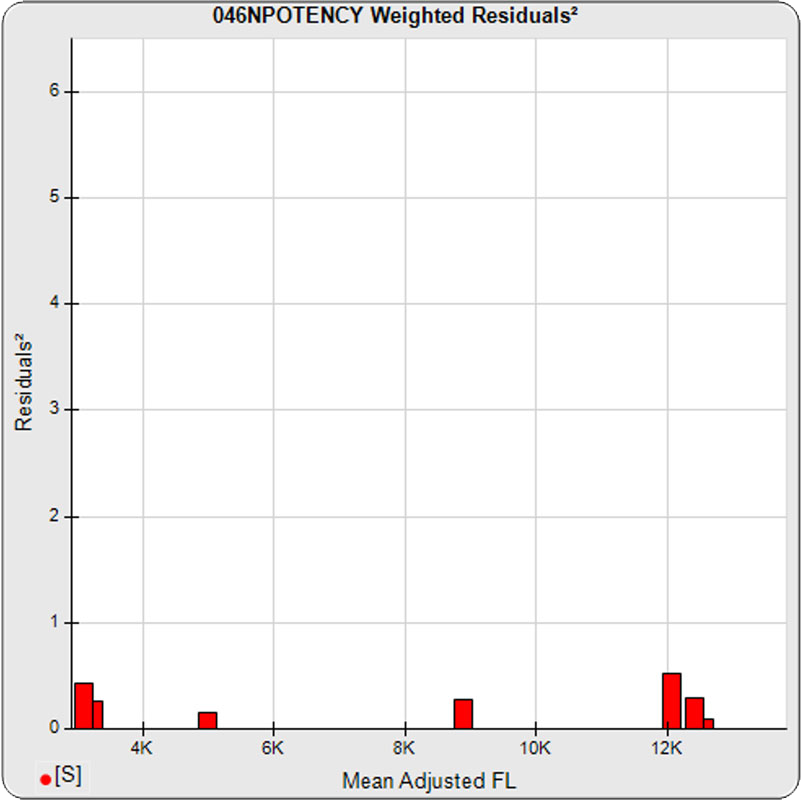
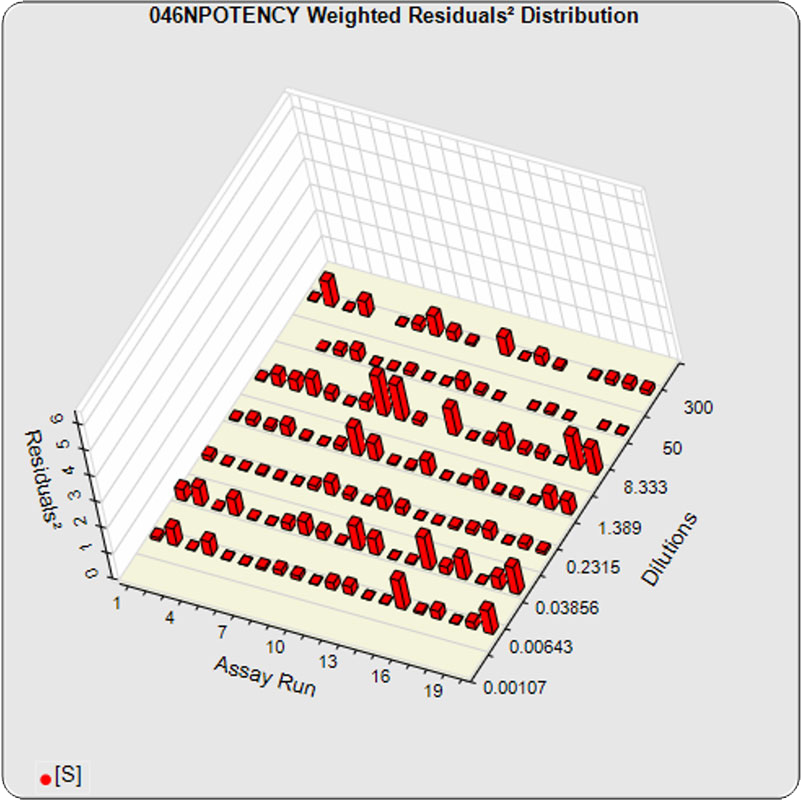
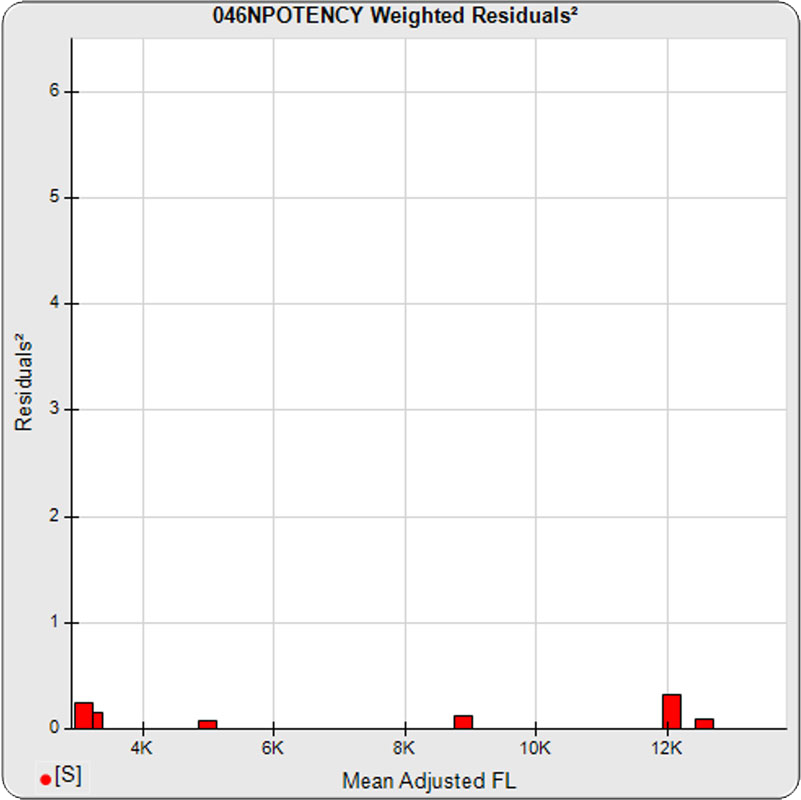
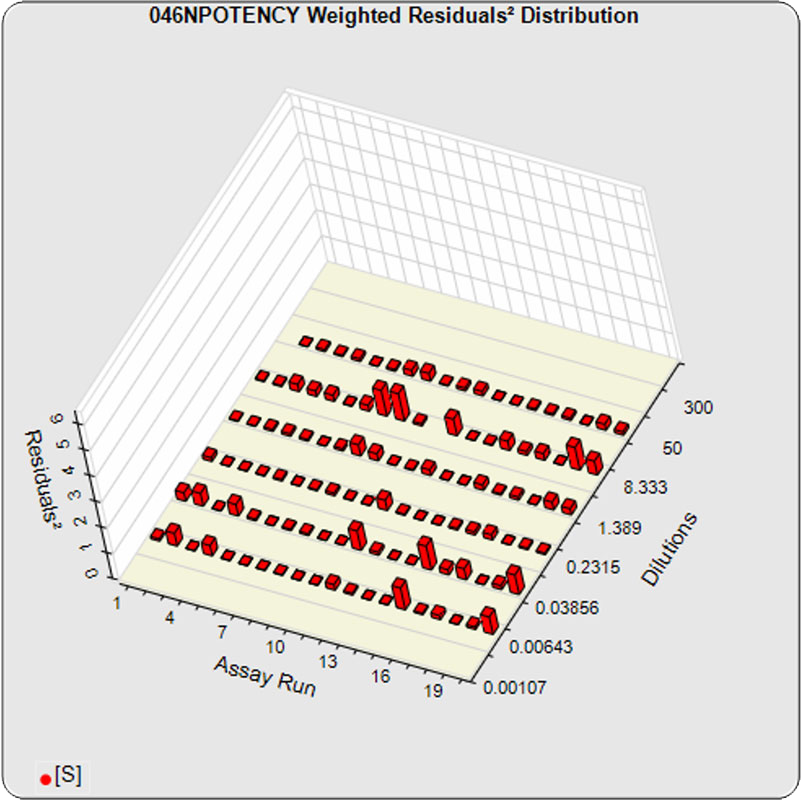
The dilutional variance regression used to determine the weighting was 0.0026 · Y1.57 (left graph). The weighting residual error (see Tech Note: Curve Weighting) was 2.15 for the 5PL and 1.92 for the 4PL, which is higher than normal. The distribution of the average weighted residuals2 of each standard dilution (center graph) shows most of the residual error is at the low dilutions. This graph, and the weighted standard residuals2 distribution (right graph), shows an unbalanced distribution of residuals2 at the low dilutions. Missing weighted standard residuals2 are residual outliers and were ignored.
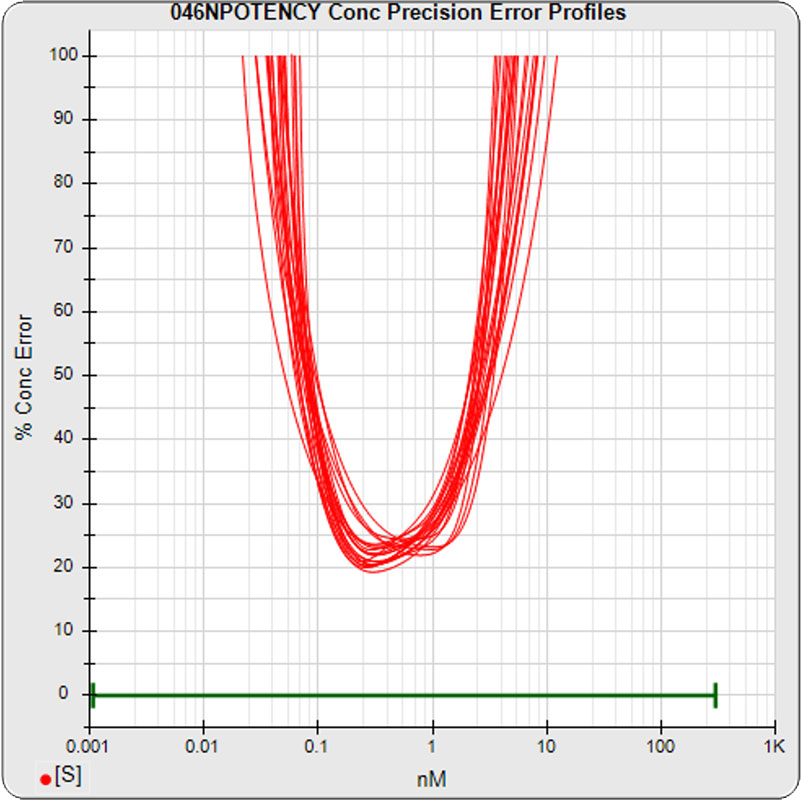
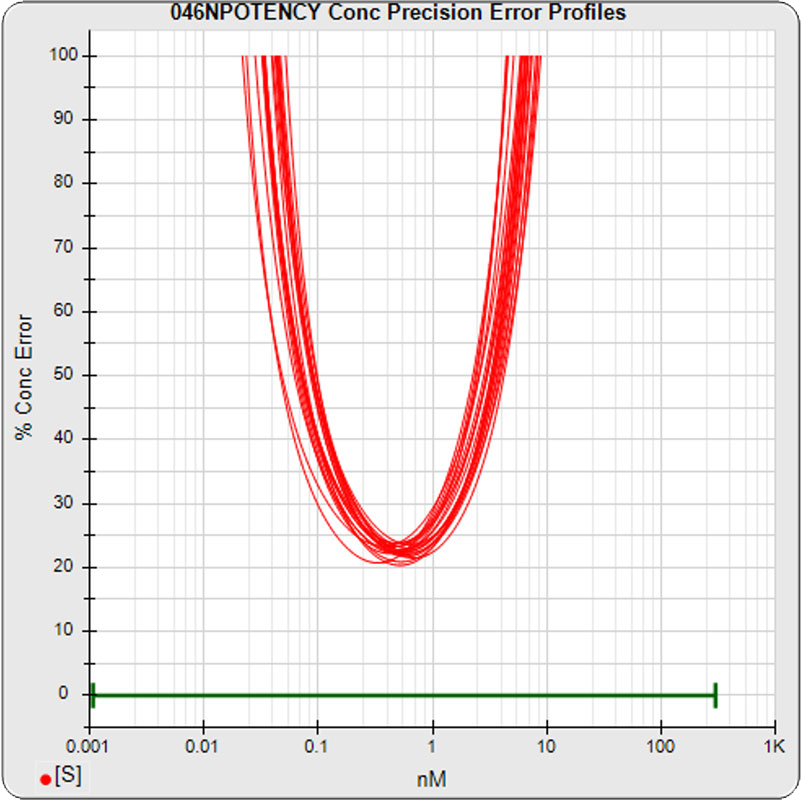
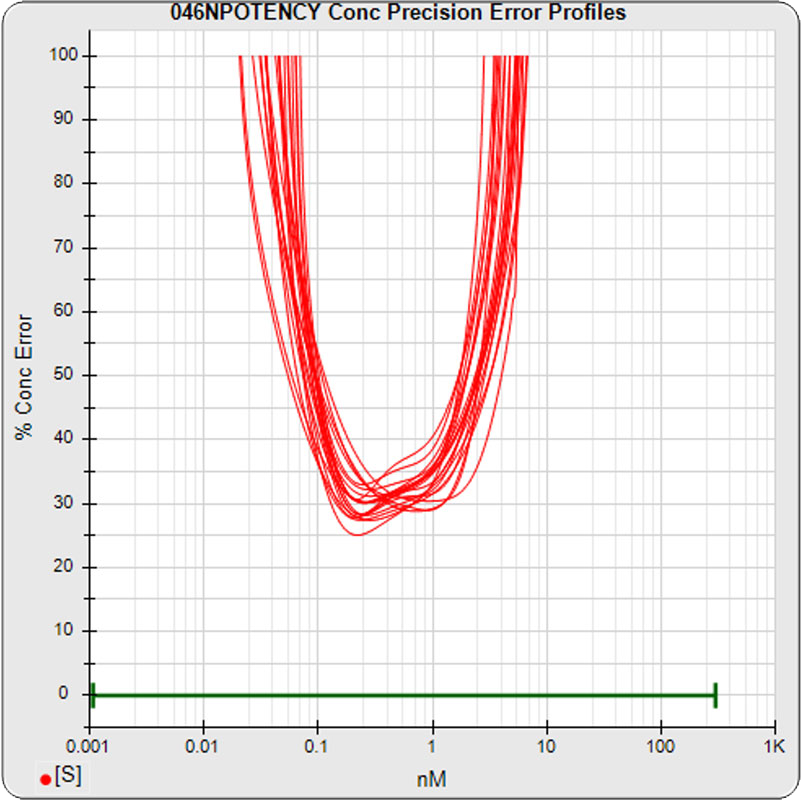
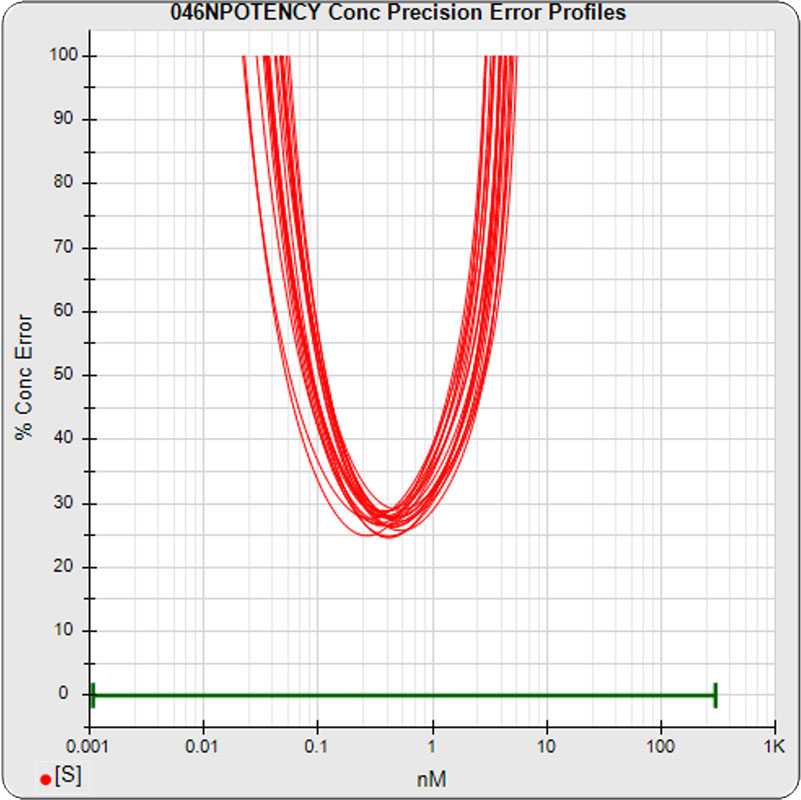
The median limits of quantitation of the standard curves at a 100% precision error threshold is 0.08 to 2.5 nM (5PL left graph) and 0.07 to 3.4 nM (4PL right graph), as shown in these precision error profile graphs of the concentration errors along the standard curves (see Tech Note: LOQs, LODs). The standard dilution range in green. These LOQs indicate that the range of effective biological activity for this potency test is less than two of the five orders of magnitude spanned by the dilution range. The concentration error at the lowest point is about 20% for the 5PL and 10% in the 4PL regressions, respectively.
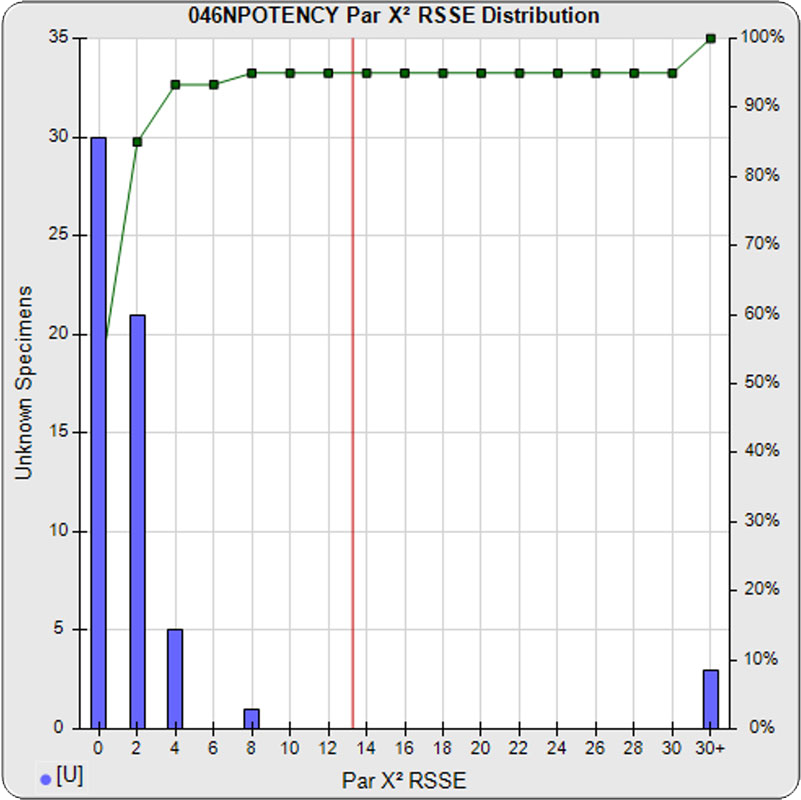
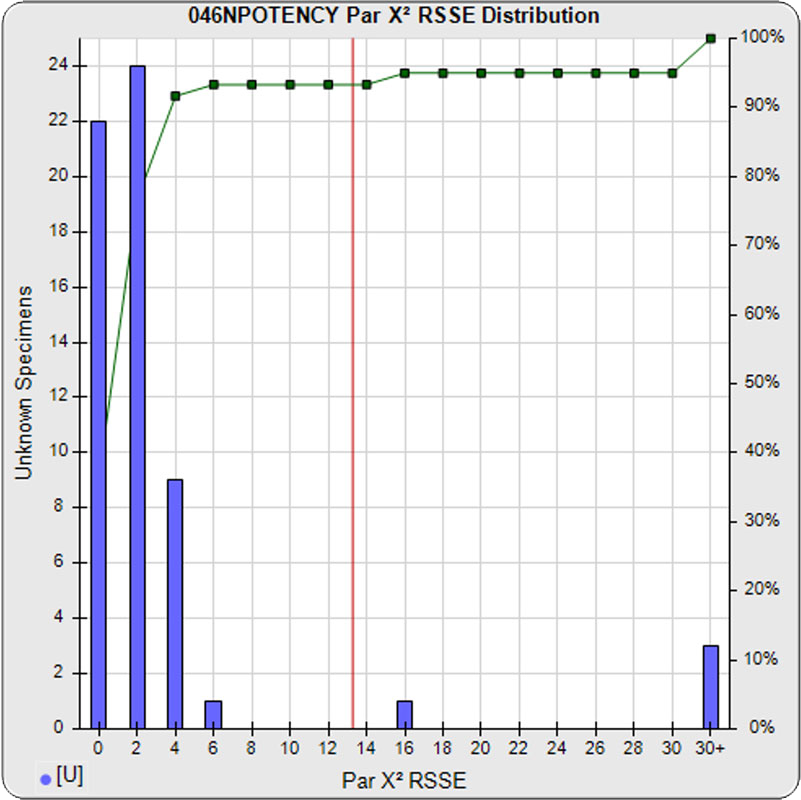
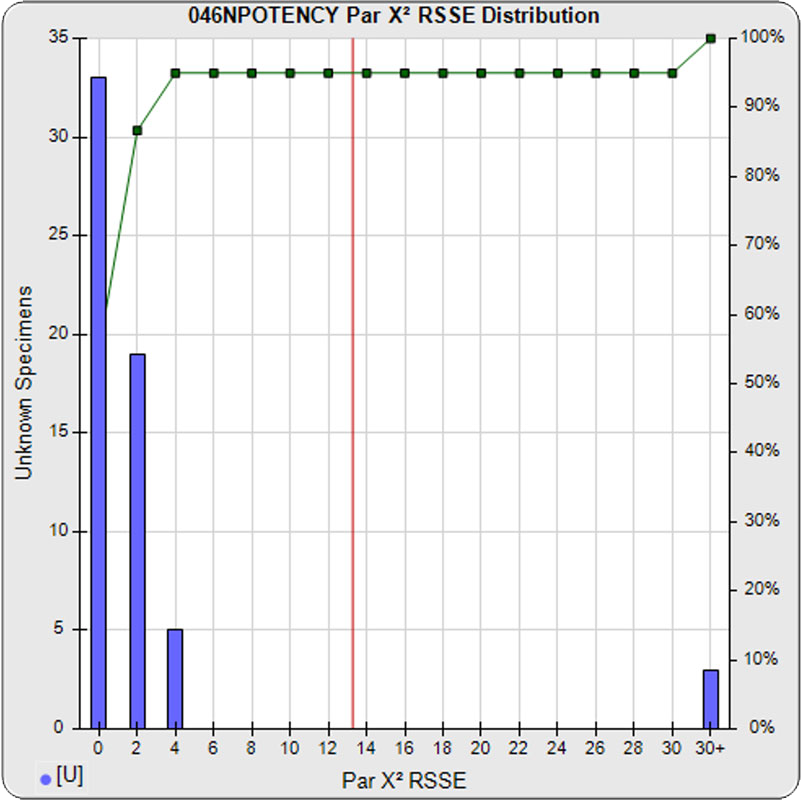
When computed using the RSSEnonpar Method (direct parallelism measure), the distribution of 57 unknown test sample nonparallel RSSEs was skewed low (left graph), with a median nonparallel RSSE of 0.92 and corresponding chi-square probability median of 0.9208. The median nonparallel RSSE from a distribution of parallel test samples should equal the degrees of freedom of 4 (P-1) and the corresponding expected median chi-square probability should be 0.5. The low RSSE median was because of the large, unbalanced residual error.
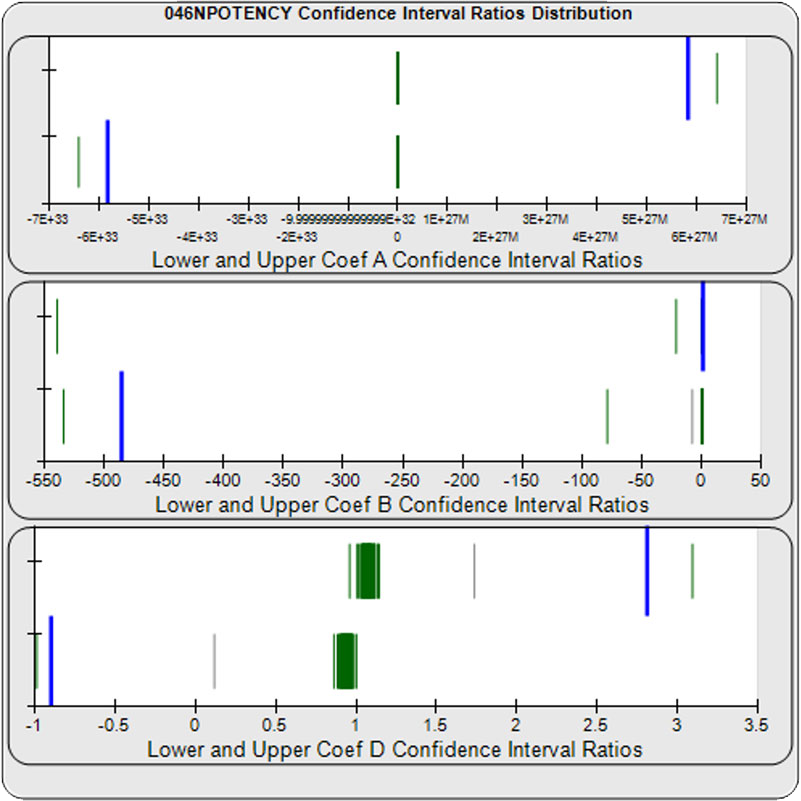
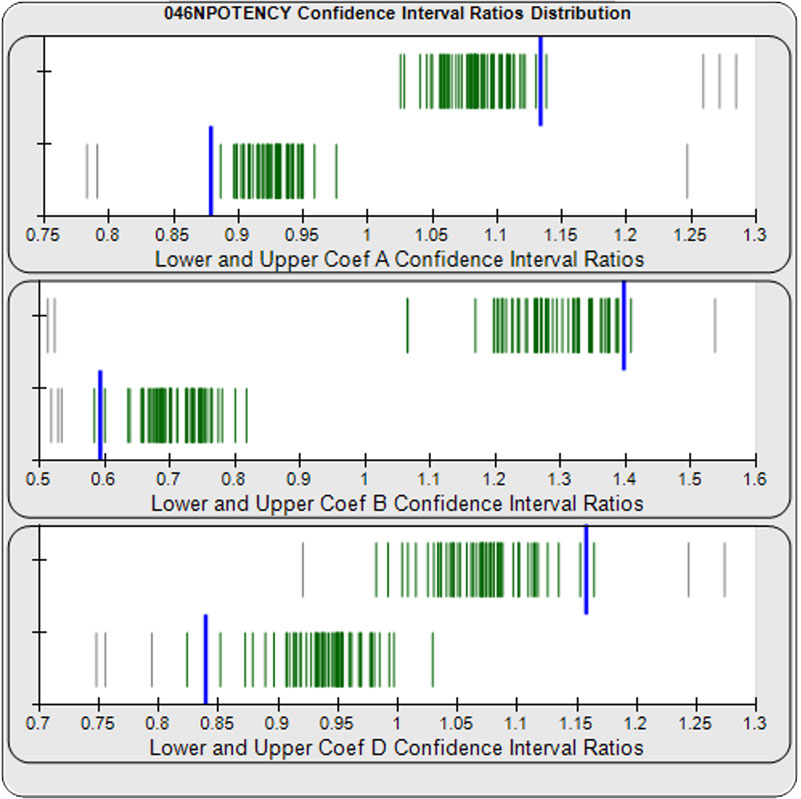
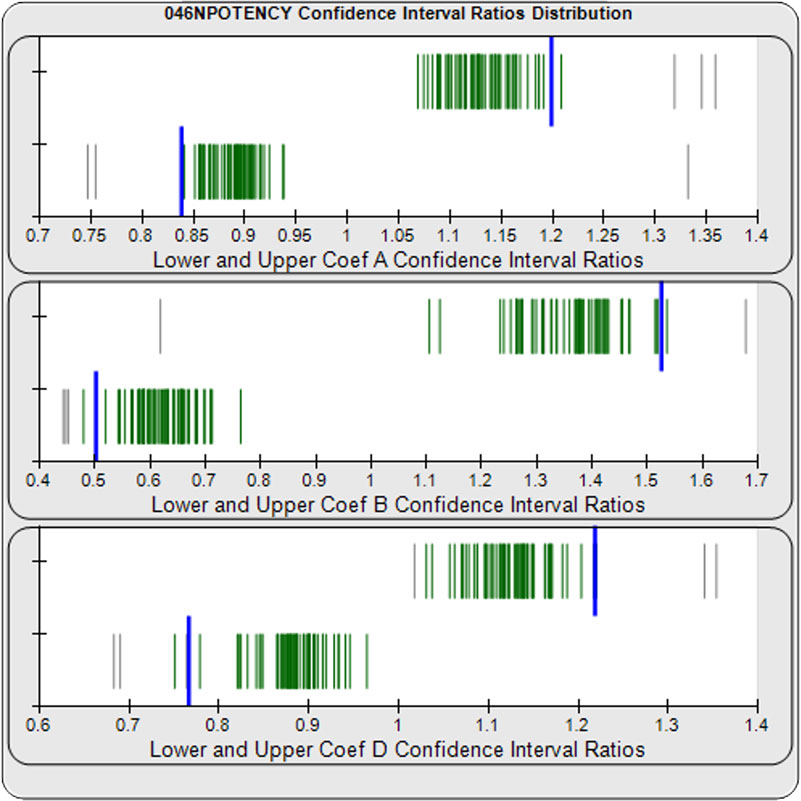
When computed using the Equivalence Method, the ratio deltas of the 57 unknown test sample/ reference standard lower and upper confidence interval limit ratio deltas (green lines) of the 4PL coefficients are shown in the right graph. Confidence intervals were determined at 0.9 confidence level using the Monte Carlo Method, which is more stable and precise than linear approximation or profile method estimates. Gray lines are delta ratios from critically failed standard or unknown curve regressions or critically failed parallelism determinations. The upper and lower goalpost borders, plotted as blue vertical lines, were computed at the 99th percentile of the respective pooled assay ratio deltas after excluding failed deltas. The upper asymptote Coef A (-5.82E+33 – 5.82E+33) and the slope of the inflection point Coef B (-485 – 1.42) ratio deltas were too scattered to obtain usable goalpost borders. The lower asymptote Coef D (-0.90 – 2.81) were less scattered but still quite wide.
LOWEST DILUTION IGNORED
The reference standard and test sample regressions were computed for all of the pooled assays with the 0.00107 nM low dilution ignored.

Masking the low 0.00107 nM dilution changed the dilutional variance’s heteroscedasticity (rate of change) and the weighting residual error. The dilutional variance regression was 0.001 · Y2.01 (left graph). The weighting residual error was (1.55 vs 2.15) for the 5PL and (1.72 vs 1.92) for the 4PL. The distribution of the average weighted residual2 of each standard dilution shows the residual error more evenly distributed (center graph). The weighted residuals2 distribution (right graph) shows a balanced distribution of all the standard dilutions.


The median limits of quantitation of the standard curves were little changed for the 5PL 0.06 – 3.26 nM (left graph) and 0.06 to 3.82 nM for 4PL (right graph) without the low dilution. The concentration error at the lowest point also remained at 20% for both regressions.
When computed using the RSSEnonpar Method (direct parallelism measure) without the low dilution in the reference standard or test samples, the distribution of nonparallel RSSEs was slightly more chi-square distributed (left graph), but still not very close to expected. The mean nonparallel RSSE was 1.31 and the corresponding chi-square probability median was 0.8602, slightly closer to their expected values of 4 (P-1 degrees of freedom) and 0.5, respectively.
When computed using the Equivalence Method without the high dilution in the reference standard or test samples, the goalpost borders computed at the 99th percentile of the lower and upper confidence limit ratio deltas for the 4PL upper asymptote Coef A (0.88 – 1.13), the slope of the inflection point Coef B (0.59 – 1.40), and lower asymptote Coef D (0.84 – 1.16) were much more tightly spread around an expected ratio of 1 than the regressions with all of the dilutions.
LOWEST AND HIGHEST DILUTIONS IGNORED
The reference standard and test sample regressions were computed for all of the pooled assays with the 0.00107 and 300 nM dilutions ignored.

Masking the low 0.00107 and high 300 nM dilution changed the dilutional variance’s heteroscedasticity (rate of change) and increased the weighting residual error of the 4PL. The dilutional variance regression was 0.002 · Y2.03 (left graph). The weighting residual error was (2.16 vs 2.15) for the 5PL and (2.34 vs 1.92) for the 4PL. The distribution of the average weighted residual2 of each standard dilution shows the residual error more evenly distributed (center graph). The weighted residuals2 distribution (right graph) shows a balanced distribution of all the standard dilutions.
The median limits of quantitation of the standard curves were little changed for the 5PL 0.06 – 3.06 nM (left graph) and 0.07 to 3.66 nM for 4PL (right graph) without the low and high dilution. The concentration error at the lowest point, however, increased to 30% for both regressions.
When computed using the RSSEnonpar Method (direct parallelism measure) without the lowest and highest dilutions in the reference standard or test samples, the distribution of nonparallel RSSEs exhibited a chi-square distribution (left graph). The mean nonparallel RSSE was 0.88 and the corresponding chi-square probability median was 0.9267.
When computed using the Equivalence Method without the lowest and highest dilutions in the reference standard or test samples, the goalpost borders computed at the 99th percentile of the lower and upper confidence limit ratio deltas for the 4PL upper asymptote Coef A (0.84 – 1.20), the slope of the inflection point Coef B (0.50 – 1.53), and the lower asymptote Coef D (0.77 – 1.22) were much more tightly spread around an expected ratio of 1 than the regressions with all of the dilutions.
Summary
ALL DILUTIONS INCLUDED
The potency test 046NPOTENCY assay results should not be considered reportable when all dilutions are used. Only the middle two dilutions (0.2315 and 1.389 nM) were within the limits of quantitation. The lowest three dilutions and the highest three dilutions, 6 of the 8 dilutions, were all on the plateaus beyond the range of any biological activity. The RSSEnonpar Method nonparallel RSSEs are skewed too low by the dilution series to identify all test samples that are not similar. And the Equivalence Method parallel deltas are too widely dispersed to yield goalpost margins that could identify test samples that are not similar.
LOWEST DILUTION IGNORED
Ignoring the lowest dilution changed the dilutional variance, lowered the weighting residual error and generated regressions with balanced weighted residuals2 distributions. Ignoring this plateaued dilution did not affect the limits of quantitation or the amount of dose error, as there were still only two bioreactive dilutions. The RSSEnonpar Method distribution of nonparallel RSSEs with the lowest dilutions ignored, although closer to the expected distribution, are still skewed low. The Equivalence Method parallel deltas with the lowest dilution ignored yielded goalpost borders that were narrow ranges for all three 4PL coefficients.
LOWEST AND HIGHEST DILUTIONS IGNORED
Ignoring the lowest and highest dilutions changed the dilutional variance but not the weighting residual error, and generated regressions with balanced weighted residuals2 distributions. Ignoring these plateaued dilutions did not affect the limits of quantitation, but the amount of error for individual doses was increased by 50%. The RSSEnonpar Method distribution of nonparallel RSSEs with the lowest and highest dilutions ignored, although closer to an expected distribution, are still skewed low. The Equivalence Method parallel deltas with the lowest and highest dilutions ignored yielded goalpost borders that were narrow ranges for all three 4PL coefficients.
RECOMMENDATION
The recommendation for this potency test 046NPOTENCY is to use dilutions more appropriate for the bioreactivity exhibited. Using the test with its current dilutions generates regressions with doses spanning 6 orders of magnitude where 6 of the 8 dilutions are nonbiologically responsive doses. Instead of 8 dilutions with a 6:1 step factor, 8 dilutions using a 2:1 step factor from 0.039 – 5 nM would closely bracket the limits of quantitation and provide a much more responsive and usable potency test.
If the dilutions cannot be changed, ignoring the lowest dilution with the RSSEnonpar Method or the Equivalence Method will provide the lowest error in the two dilutions that are biologically responsive. All 57 assays should be recomputed using these conditions.