Monte Carlo Method and Profile Method
Monte Carlo Method Versus Profile Method For Determining Potency Confidence Intervals
Potency tests require an estimation of the confidence limits of the relative potency determination between two dilution curves to measure its reliability. The relative potency is the horizontal shift parameter resulting from the minimization of the two dilution curves constrained to the same shape (the constrained curves). Additionally, one of the parallelism methods cited in the USP 1032, 1033, 1034 guidelines, the Equivalence Method (Confidence Interval Parallelism) requires estimations of the confidence intervals of the unconstrained curve parameters. Most potency tests create nonlinear regression curves, which are more complex to compute than linear regressions. Because the parameters of these curves are not independent and co-vary, it is necessary to find the joint confidence region of the parameter, which can be approximated as a probability mass density (volume).
For linear regressions, the joint confidence region is always a multidimensional ellipsoid. For nonlinear regressions, the joint confidence region is much more complex. Two or three-dimensional projections of nonlinear joint confidence intervals reveal long curved helixes that fold back on themselves, long, thin banana-like shapes, and many more forms. Four, five and six-dimensional nonlinear joint confidence intervals result in even more complex forms. Currently, finding the actual full, true joint confidence interval for nonlinear regressions is an unsolved problem. The Equivalence Method therefore estimates the confidence intervals of each parameter as a separate determination.
PROFILE METHOD
The Profile method defines the ends of the confidence intervals for an individual parameter to be the extreme ends of the joint confidence region along the axis of the parameter of interest at a specified level of significance. The confidence interval includes all of the area between these ends. The Profile method uses numerical techniques to find these endpoints but does not determine the mass (volume) of the entire joint confidence region. Joint confidence regions that have longer thin sections near the ends and wider middle regions than others can greatly affect the endpoint estimates without an appreciable change in the actual mass distribution of the parameter.
MONTE CARLO METHOD
The Monte Carlo method determines the confidence interval from a number of simulated fits using the same regression model that was used to fit the original data. This method requires an accurate estimation of the variation of the data in order to generate reliable simulations (see Tech Note: Curve Weighting). Because the same weighted regression model is used, each fit fully accounts for all of the nonlinearities inherent in the regression and there are no approximations. The reliability of the estimates increases with more simulations. After the simulations have been computed, conventional statistical methods are used to estimate the confidence interval at a specified level of significance. The confidence interval from the Monte Carlo simulations is a density determination of the probability mass and is not affected by the shape of the confidence region. It is a good estimate of the true marginal confidence interval.
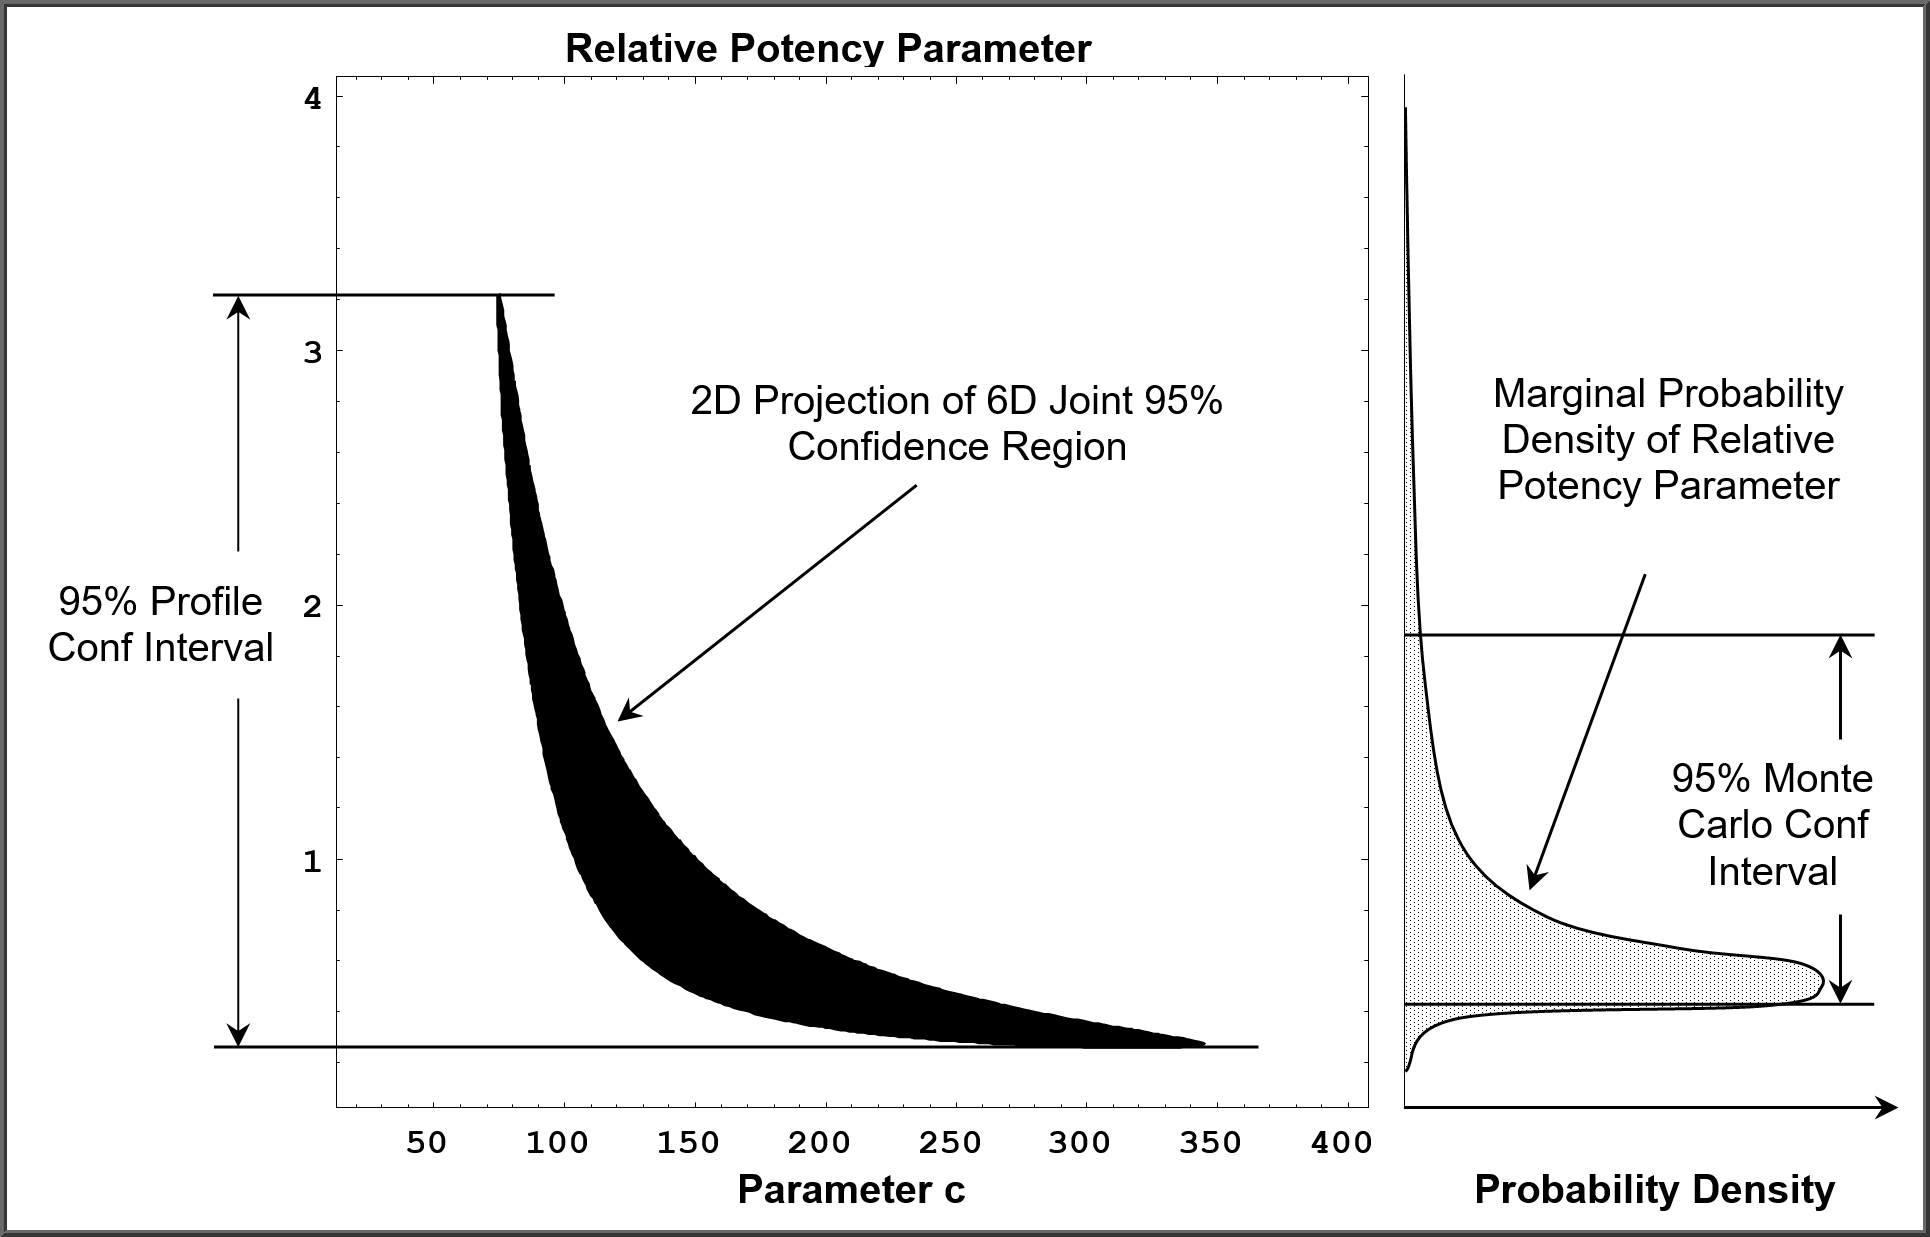
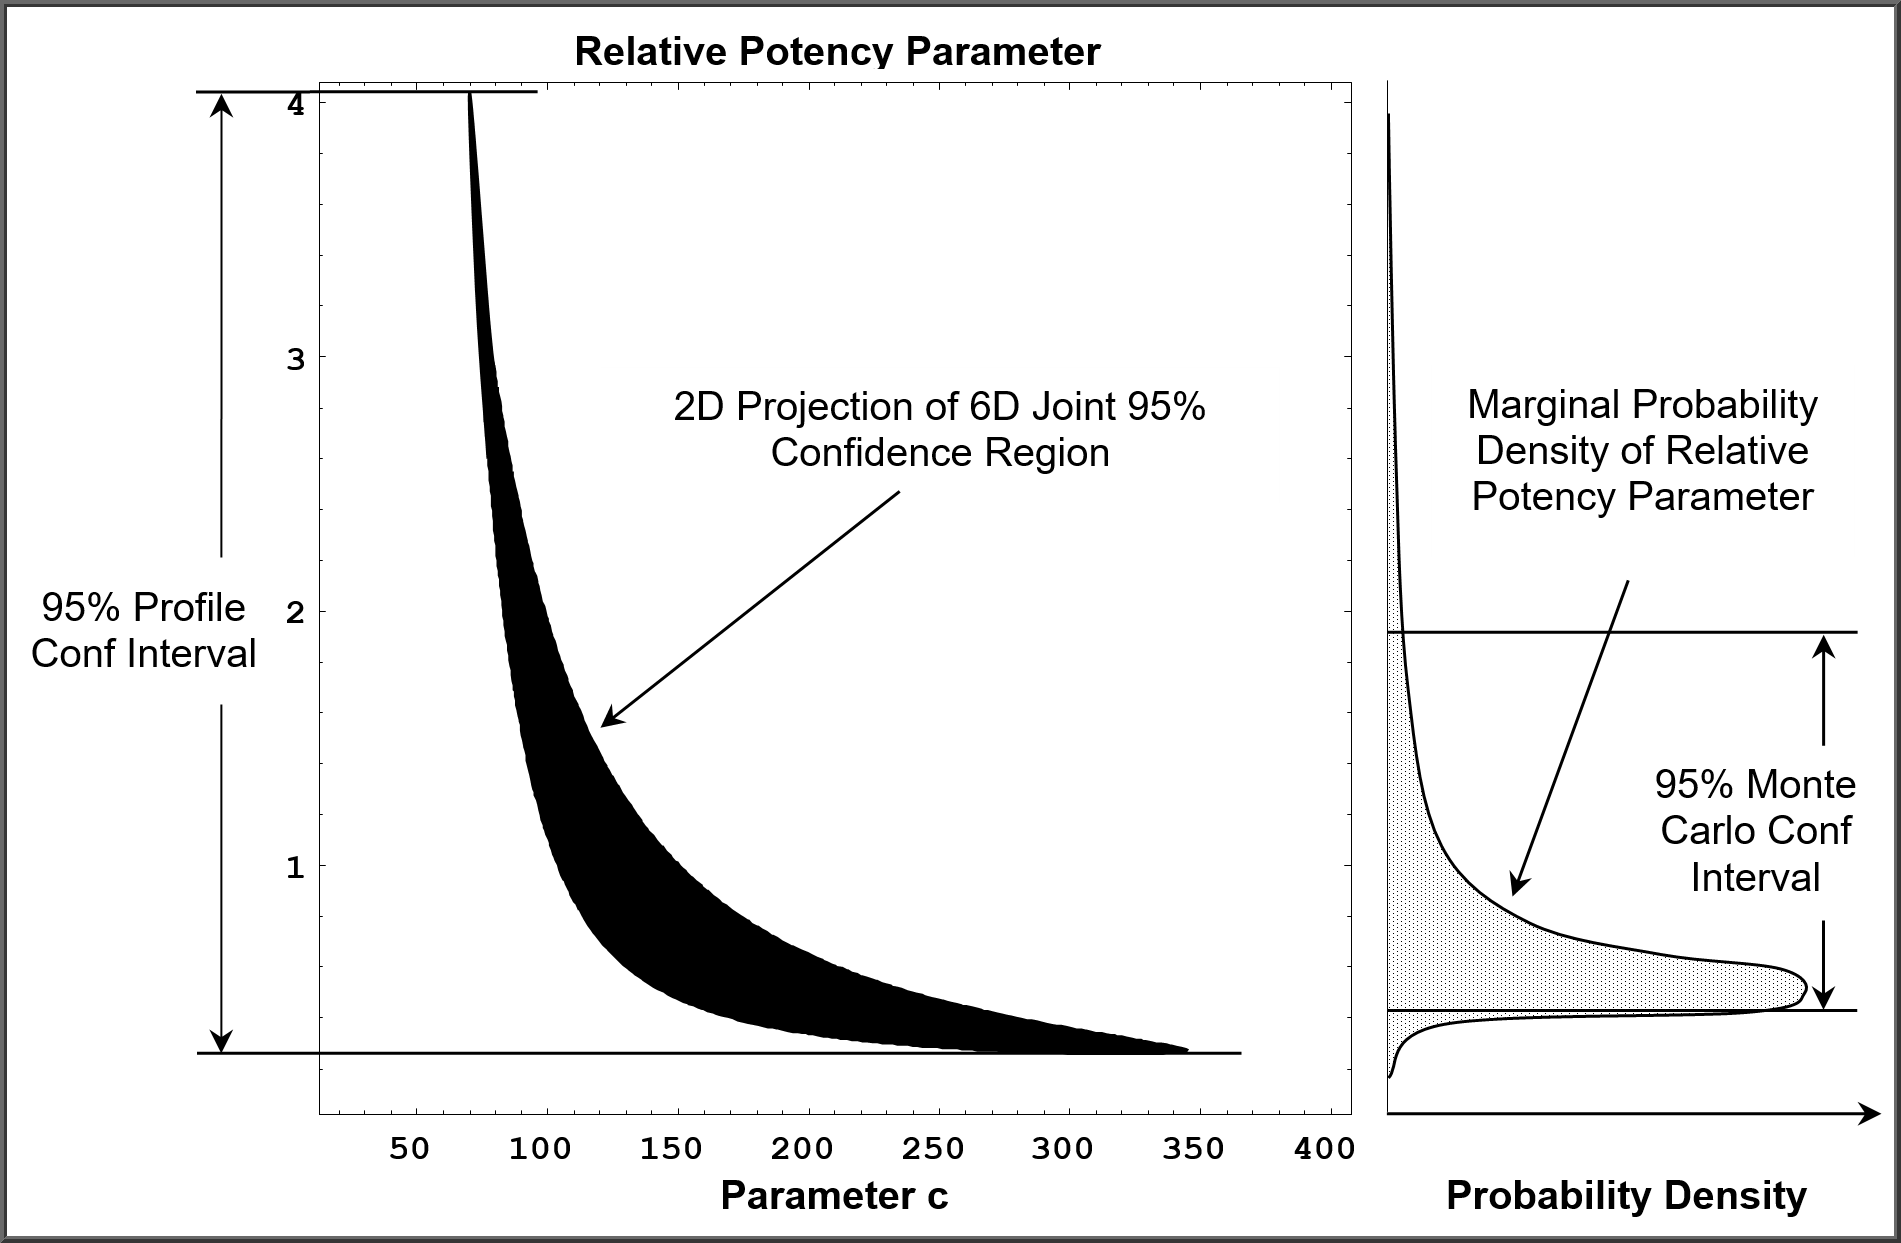
The black region represents the 2-dimensional projection of the 6-dimensional confidence region associated with the constrained regression of two 5PL curves to obtain the best estimate of the relative potency parameter. The Profile confidence intervals are shown on the left of the graphs, and the Monte Carlo confidence intervals are shown on the right of the graphs.
Figure 2 shows a less well-conditioned regression that has a longer “neck” on the banana-shaped confidence region than the regression in Figure 1. This ill-conditioned curve considerably lengthens the Profile confidence interval but has little effect on the Monte Carlo confidence interval because the probability mass contained in the longer “neck” is so small. These longer “necks” occur often in nonlinear regressions but seldom in linear regressions. This is why the Monte Carlo method generates more stable and precise confidence intervals over multiple potency assays than the Profile method.
REFERENCES
Bates DM, Watts DG. Nonlinear Regression Analysis and Its Applications. New York: Wiley, 1988.
Draper NR and Smith H. Applied Regression Analysis, 3rd Edition. New York: Wiley, 1998.
Dunn JR, Wild D. Calibration Curve Fitting. The Immunoassay Handbook, Theory and Applications of Ligand Binding, ELISA and Related Techniques, 4th Edition, 323–336, 2013.
Gottschalk PG, Dunn JR. Determining the Error of Dose Estimates and Minimum and Maximum Acceptable Concentrations from Assays with Nonlinear Dose-Response Curves. Computer Methods and Programs in Biomedicine, 204-215, 2005.
Gottschalk PG, Dunn JR. Measuring Parallelism, Linearity and Relative Potency in Immunoassay and Bioassay Data, Journal of Pharmaceutical Biostatistics 2005, 15 (3), 437–463.
Gottschalk PG, Dunn JR. The Five Parameter Logistic: A Characterization And Comparison With The Four Parameter Logistic. Analytical Biochemistry: 343, 54–65, 2005.
Liu JS. Monte Carlo Strategies in Scientific Computing. New York: Springer, 2004.
Press WH, Teukolsky SA, Vetterling WT, Flannery BP. Numerical Recipes, 3rd Edition. New York: Cambridge University Press, 2007.
Seber GAF, Wild CJ. Nonlinear Regression. Hoboken NJ: Wiley, 2003.
www.brendan.com