BLOG Briefs
Brief product notes about running, developing, analyzing, and managing immunoassays, potency bioassays, and immunogenicity assays.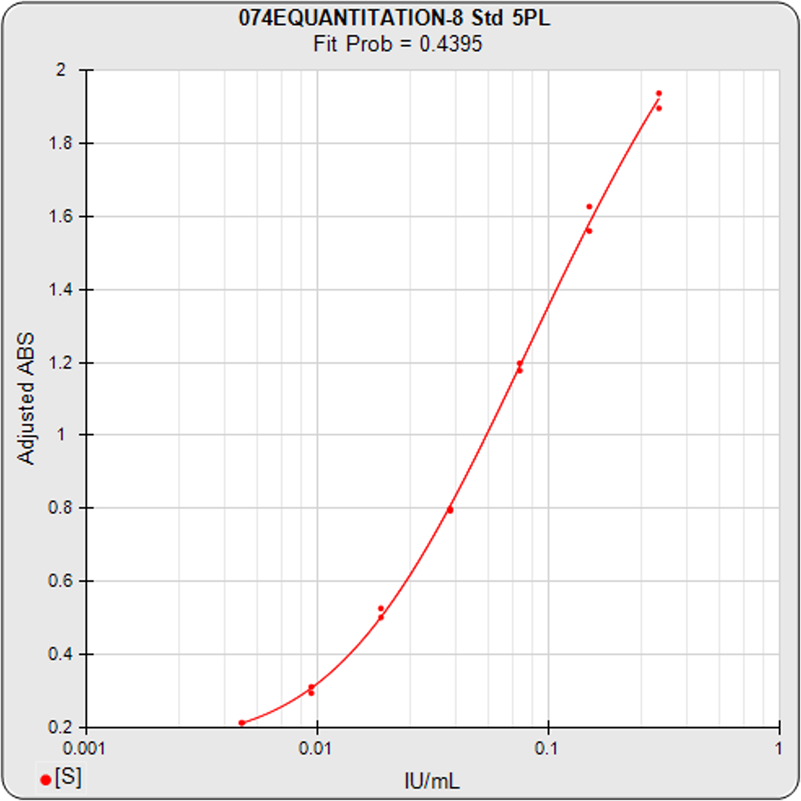
Is My Curve Good?
STATLIA MATRIX includes a high resolution graph, goodness of fit metrics, and other graphs and metrics to reliably determine if your curve fit is good.
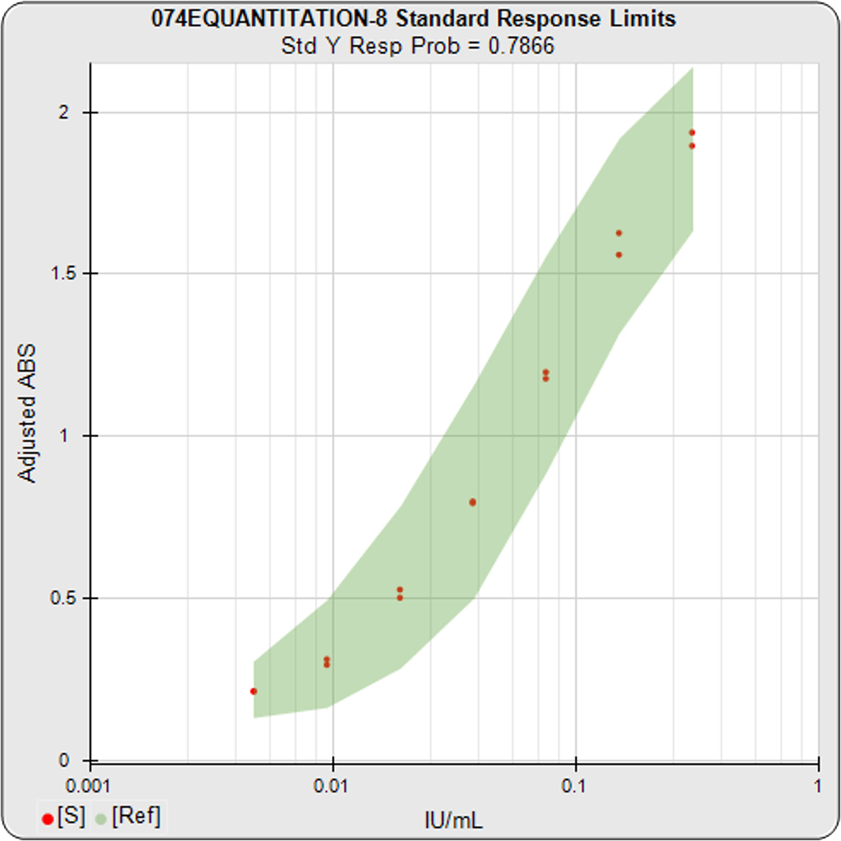
Is My Assay Good?
STATLIA MATRIX graphs can tell you at a glance if your assay is performing as expected.
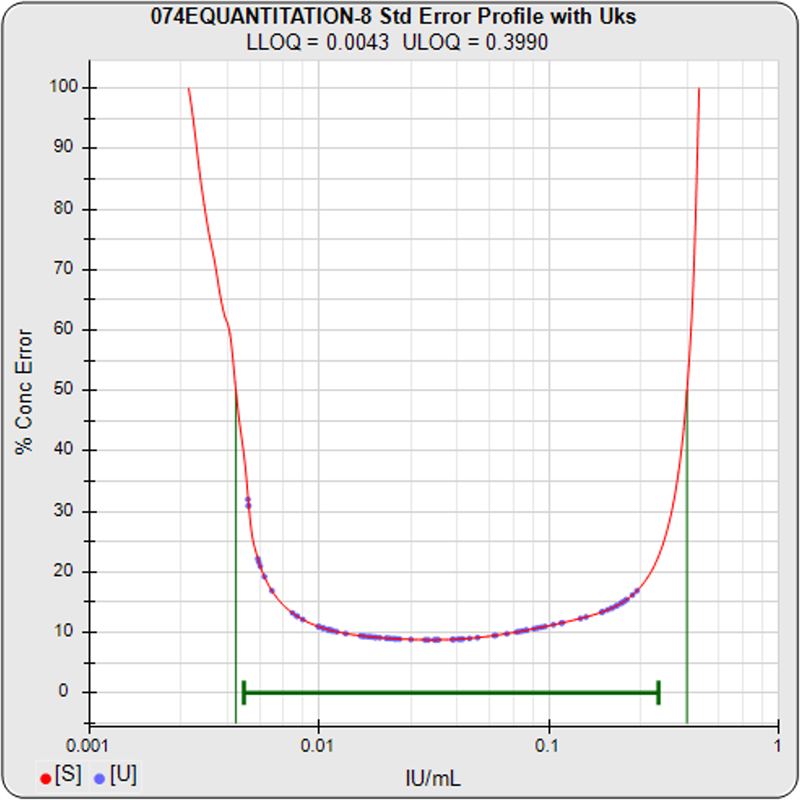
Is My Reportable Range Effective?
The Standard Error Profile graph makes it easy to confirm that your reportable range is within your Limits of Quantitation.

3 Parallelism Methods for Relative Potency Assays
STATLIA MATRIX provides 3 methods for determining parallelism: the Equivalence Method (empirical test), RSSE (Chi-Square) Method (direct measure of parallelism), and the F Test (hypothesis test).
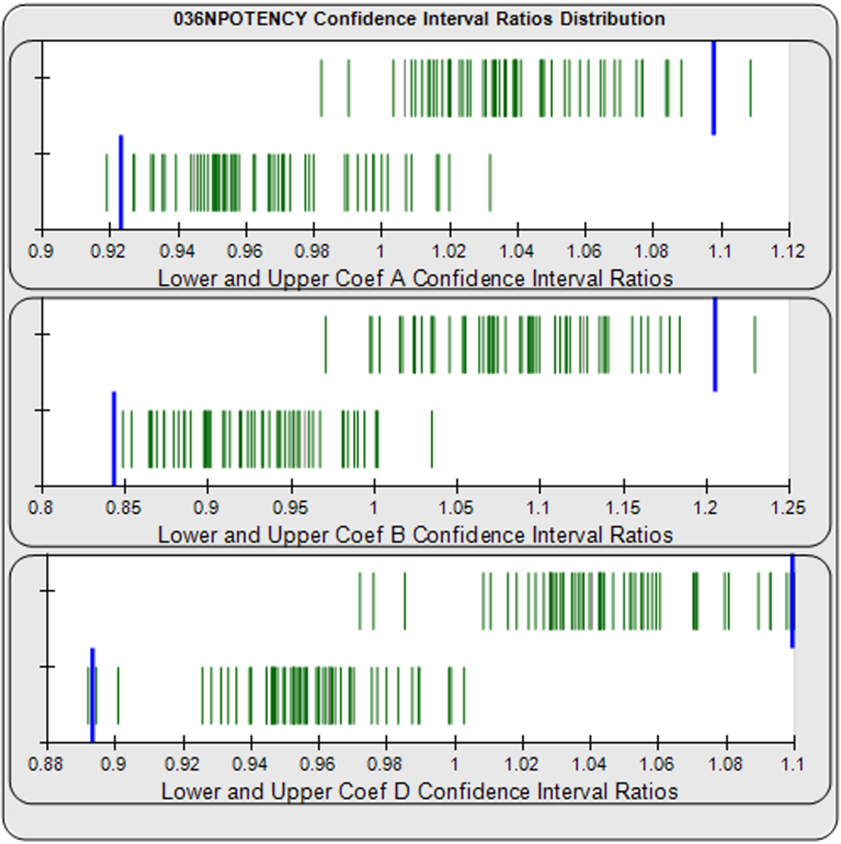
Determine Parallelism Thresholds Automatically
STATLIA MATRIX automatically computes thresholds for the Equivalence and Chi Square methods for parallelism in relative potency assays from a pool of your previously run assays.

Streamline and Improve Assay Workflow
Integrate multiple users, instruments, desktops (virtual or PC), and a secure Microsoft SQL Server database on one STATLIA MATRIX software system.

Method Validation Reports
Generate Method Validation reports in minutes following the FDA’s Method Validation Guidance for Industry. Select, organize and analyze in minutes – with one click

Expand Reportable Range with 5PL
Many ELISA curves are too asymmetric to be fit accurately with the symmetric 4PL. Bad fits at the upper and lower ends of these 4PL curves show why an appropriately weighted 5PL can extend the usable range of asymmetric curves up to an order of magnitude in sensitivity.

Compute Asymmetric Cell-Based Potency Assay Curves with 5PL
Some cell-based bioassays are significantly asymmetric and characterized by a very sharp transition at the upper or lower asymptote and a more gradual transition to the other asymptote. The fifth parameter in a 5PL enables the curve to fit two distinctly different end shapes and yield a reliable determination of similarity (parallelism).

New Control Graphs Simplify Assay Acceptance
Dose and response limits for each control are computed automatically from a pool of your previously run assays. Use these limits or enter your own for the assay.