Good Reportable Range
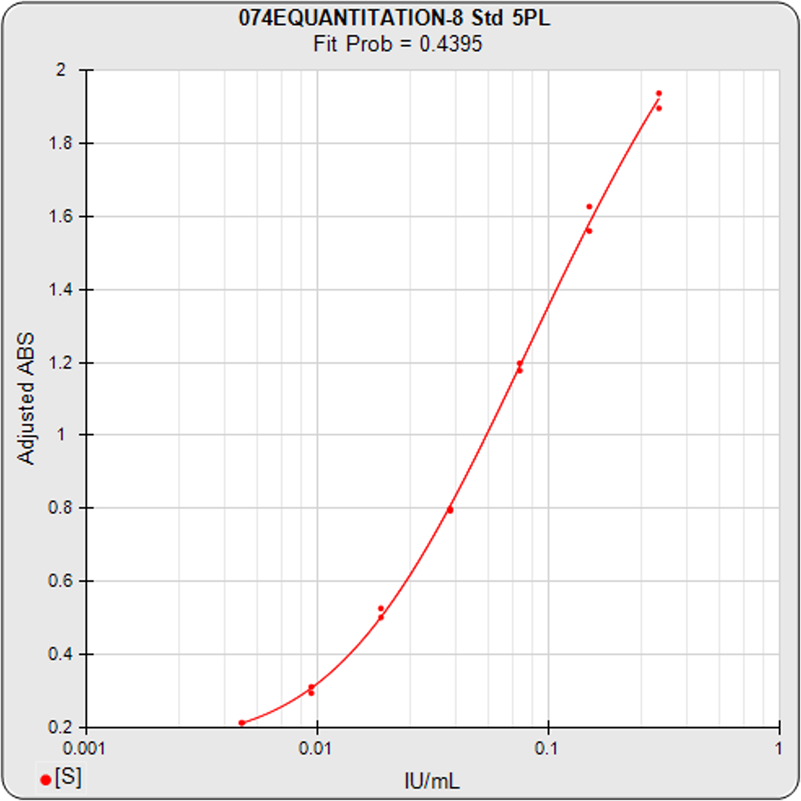
Standard Curve
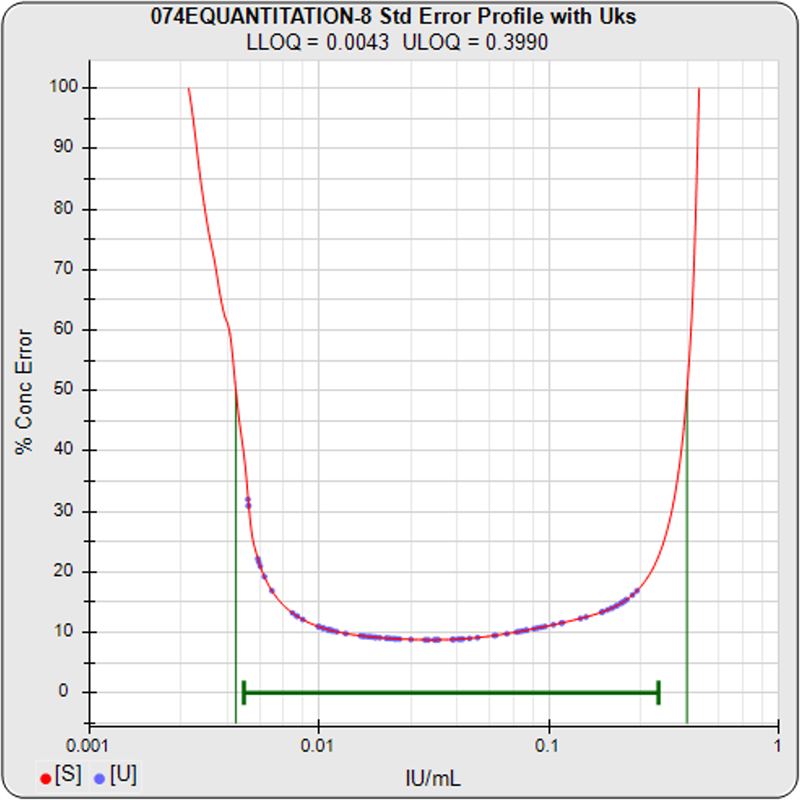
Concentration Error Profile
The red line in the second graph shows the %Conc Error (Y-axis) for every concentration (X-axis) along the standard curve. The lab sets the Limits of Quantitation precision error objectives (50% error here), marked by the vertical green lines. The horizontal green bar is the reportable range set by the lab. The blue dots are each unknown concentration result and error. The graph shows that the reportable range is within the LLOQ and ULOQ targets of this assay, and that most unknown results have an error rate around 10%. This means that the true unknown result of most of these unknowns is +/- 10% of the computed concentration.
Good reportable range. Reliable results. Easy to see.
Download the Limits of Quantitation Tech Note for more details on the graph above. By entering your own data in a STATLIA MATRIX demo, you can see how this graph and the many other graphs and metrics in the software can make a difference in your laboratory.