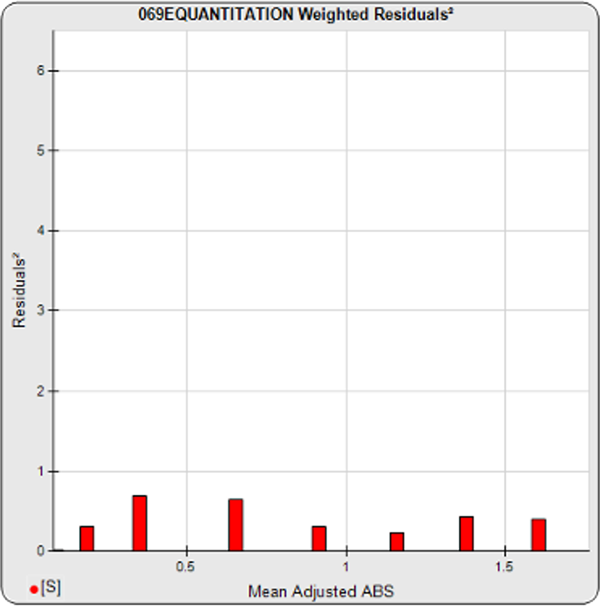
Standard Dilution Response Residuals²
- The individual residuals² (red bars) are the pooled assay averages of the squared differences between the observed and predicted response off the curve of each dilution, divided by its expected variance (weight).
- The sum of these residual² averages should equal the degrees of freedom (number of points – number of curve parameters).
- The distances between adjacent standard dilutions should be relatively uniform.
- There should be no clumping of responses at either end. Clumped responses have higher than average residuals² and worsen the fit and accuracy of the regression curve. Clumped responses at the ends often indicate nonmonotonic hooks.