Standard Dilution Response Limits Are Established For You
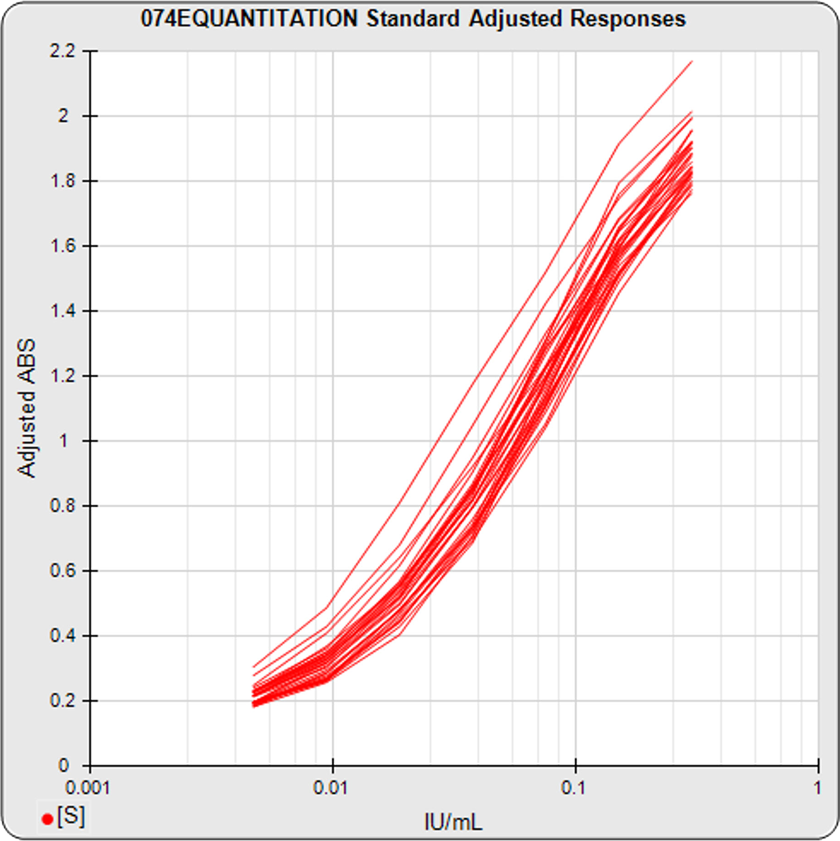
- The graph on the left shows the responses from each of the standard dilution series in your pooled assays.
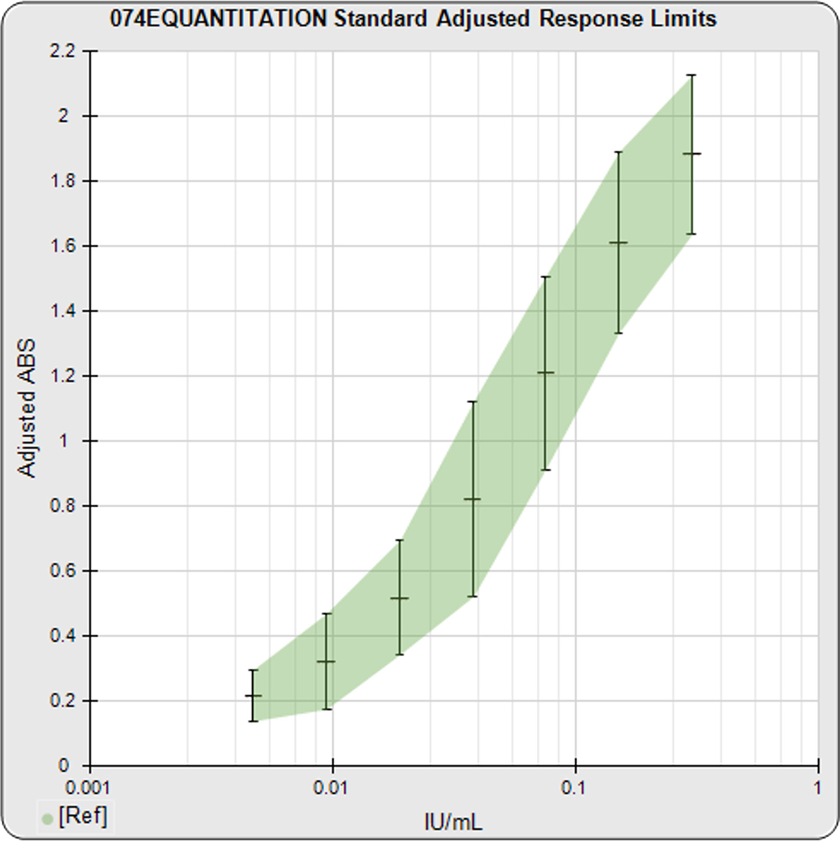
- The graph in the middle shows the confidence limits for each standard dilution using the data from your pooled assay responses, after filtering out any outliers.
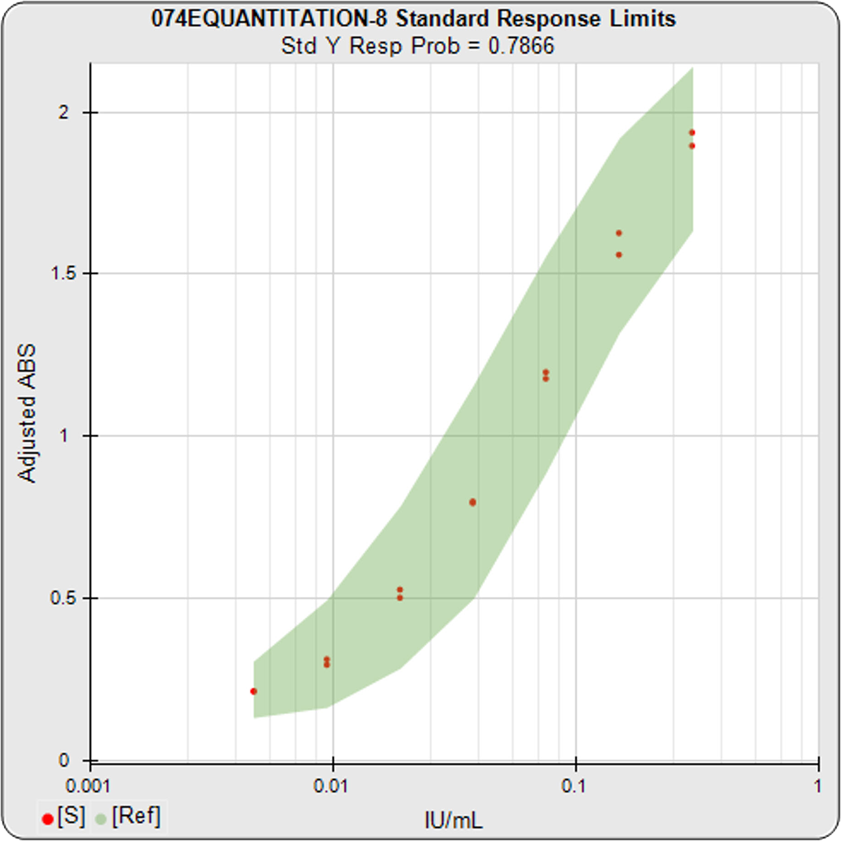
- The graph on the right shows these limits plotted with the standard dilution responses (red dots) of your assay. From this graph, you can see how the assay is behaving compared to the expected behavior determined by your previous assays.