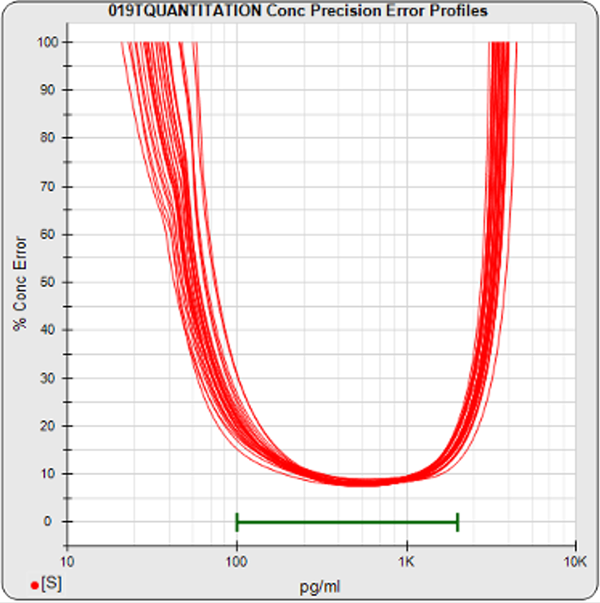
Standard Curve Precision Error Profiles
- STATLIA MATRIX generates precision error profiles (red lines) of the concentration errors of the pooled standard curves, plotted against the desired reportable range (green bar). See the manuscript on the software’s error profile method.
- These plots shows the limits of quantitation at any desired concentration error threshold under the protocol conditions of the pooled assays.
- Precision error limits of quantitation often can be expanded by changing standard dilution doses or other protocol conditions.
- The precision error profiles allow you to gauge the usability of the test protocol against the desired reportable dose range of a quantitation test or effective dose range of a potency test.