Expand Reportable Range with 5PL Curve Fitting
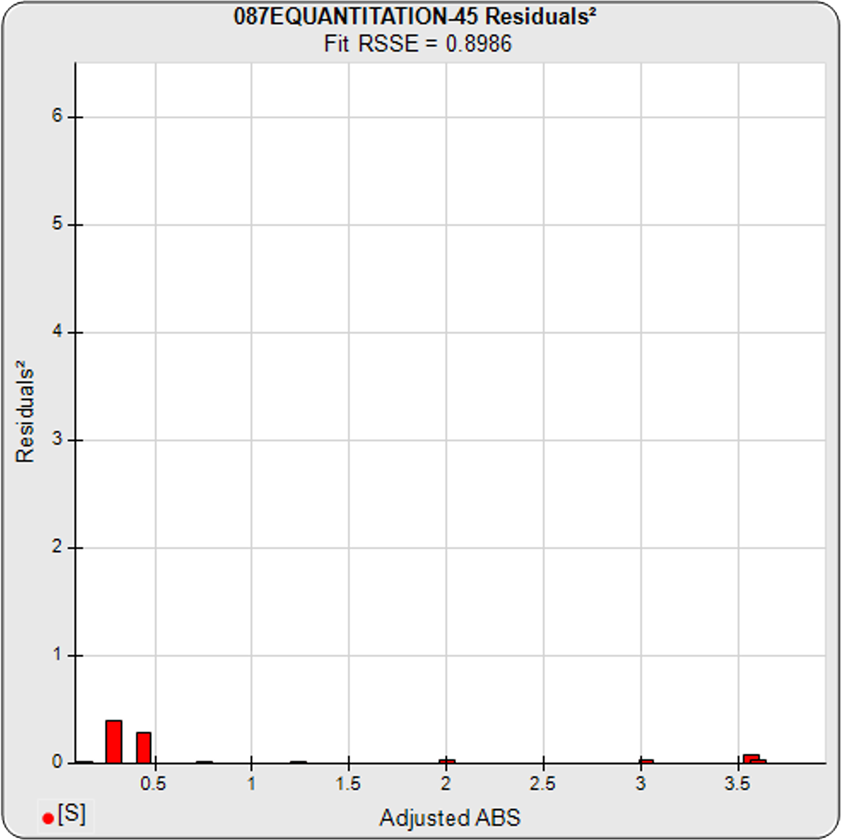
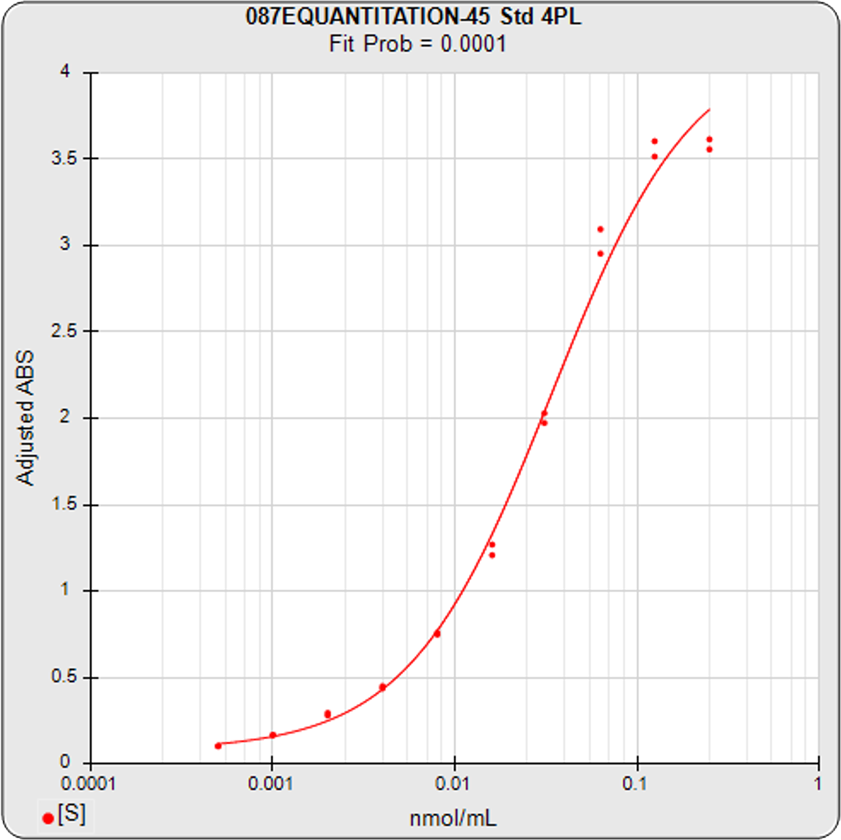
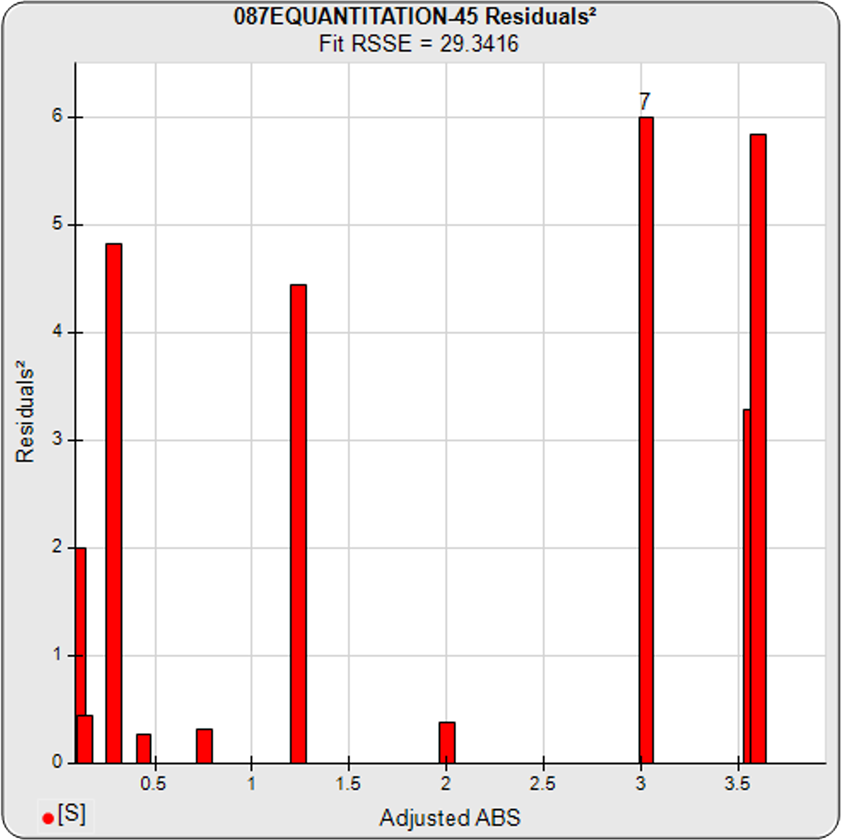
Many ELISA curves are too asymmetric to be fit accurately with the symmetric 4PL curve fit, like the assay above. The 5PL curve and 4PL curve and their dilution squared residuals (above graphs) were computed using the same data. The dilution squared residuals graphs show the weighted squared residual errors (red bars) between the observed responses and predicted responses off the curve.
To learn more, download Brendan Bioanalytics Tech Note: 5PL and 4PL Curve Fitting.
The sharp transition at the upper asymptote and the more gradual transition to the lower asymptote is typical for ELISA assays. Scaling effects in semi-log standard curve graphs always make the low end appear to be a better fit than it actually is compared to the high end. But in the weighted residual2 graph, the lack of fit of the 4PL is clear. These bad fits at the upper and lower ends of the 4PL curves show why an appropriately weighted 5PL curve fit can extend the usable range of asymmetric curves up to an order of magnitude in sensitivity. STATLIA MATRIX’s weighted 5PL curve fitting model is the best in the industry and will easily fit your assays’ curves whatever their shapes.
See manuscript on the software’s weighted 5PL model that has been requested more than 5,000 times and cited more than 300 times: The Five Parameter Logistic: A Characterization And Comparison With The Four Parameter Logistic.


