Precision Error Profiles
Uk Conc Precision Errors
Uk Ref Range
Set Reportable Range to Match Unknown Population
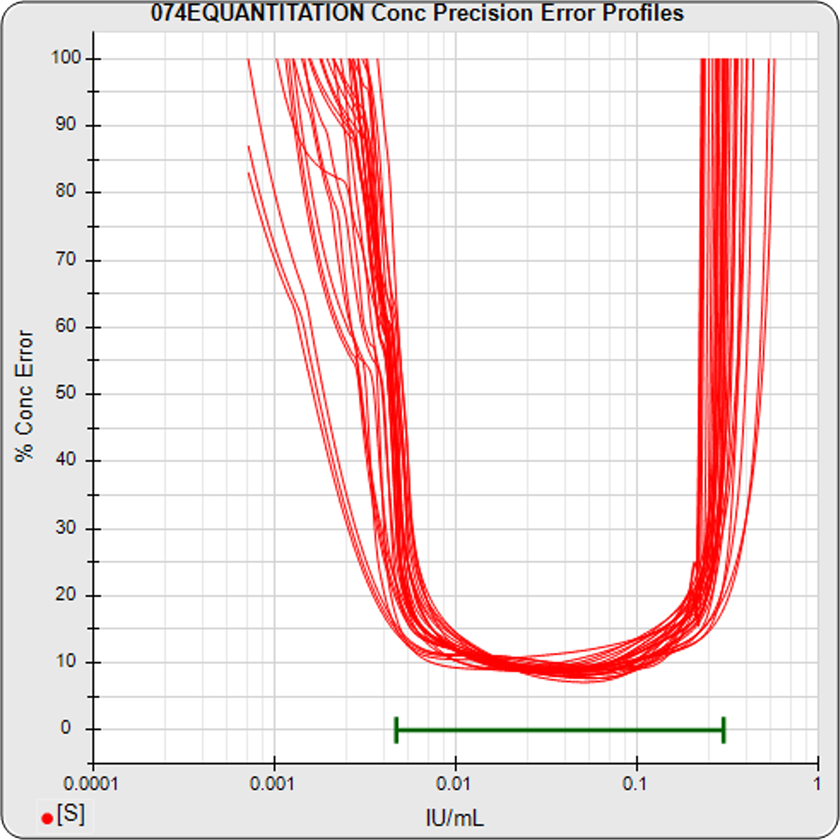
- The graph on the left shows the standard curve concentration precision errors from a pool of your previous assays. This graph can be used to establish a reliable reportable range (green horizontal bar) for this test. See the Tech Note: LOQs, LODs on the software’s precision error profile method, or the manuscript: The Five Parameter Logistic: A Characterization And Comparison With The Four Parameter Logistic.
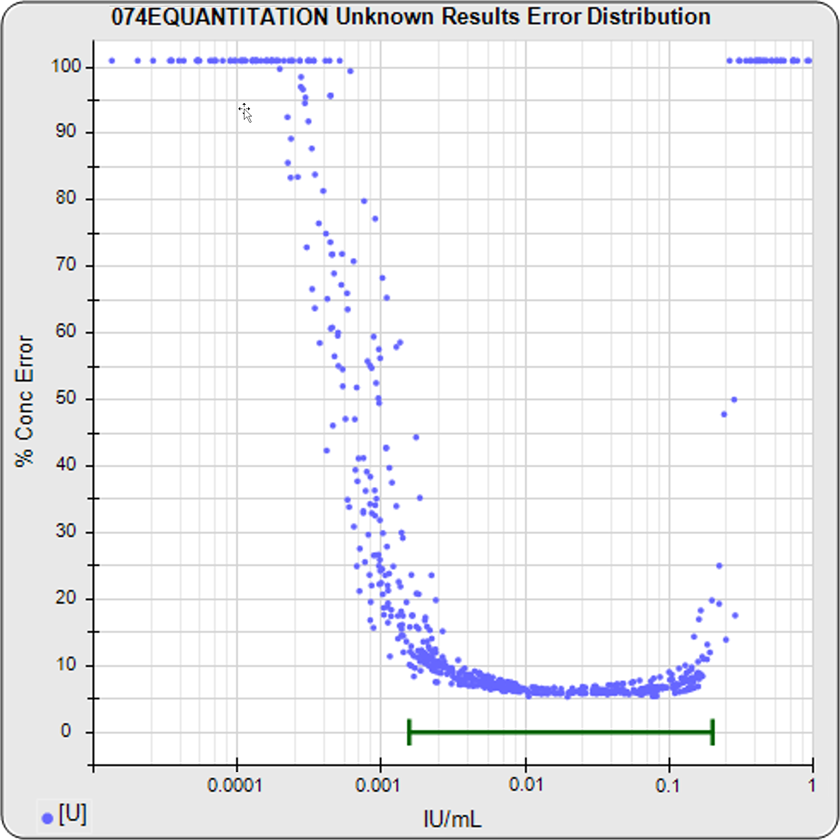
- The middle graph shows a distribution of concentration precision errors from the unknowns of a pool of your previously run assays. This graph shows how well the reportable range (green horizontal bar) matches the unknown population.
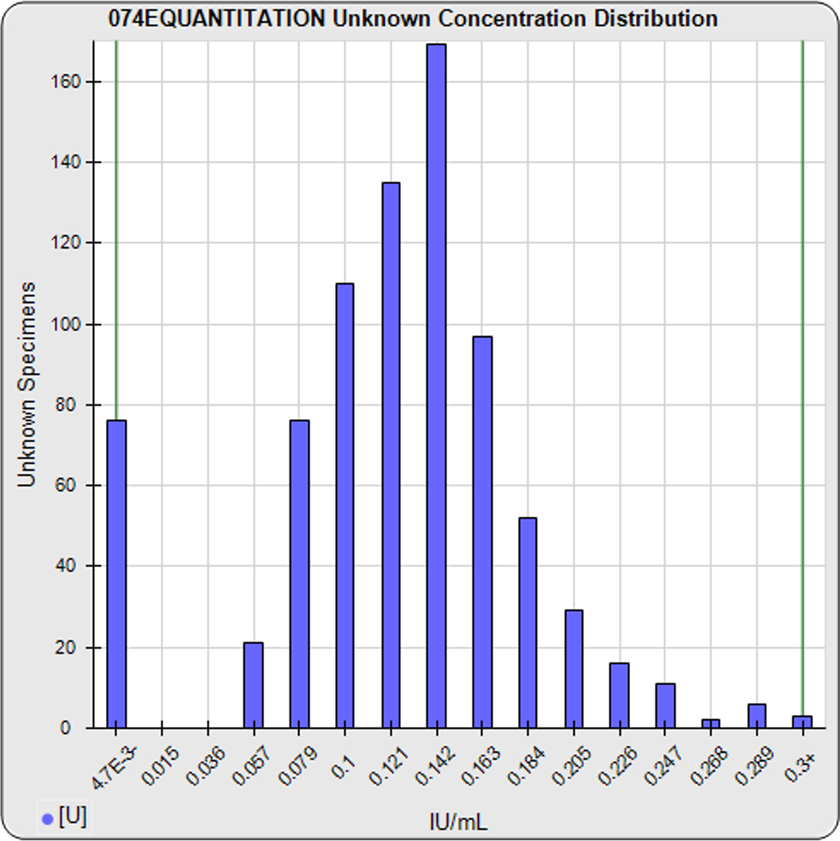
- The distribution of unknown concentrations from your pooled assays shows the behavior of your test population and can be used to establish a reference range for that population.