Good Curve Fit
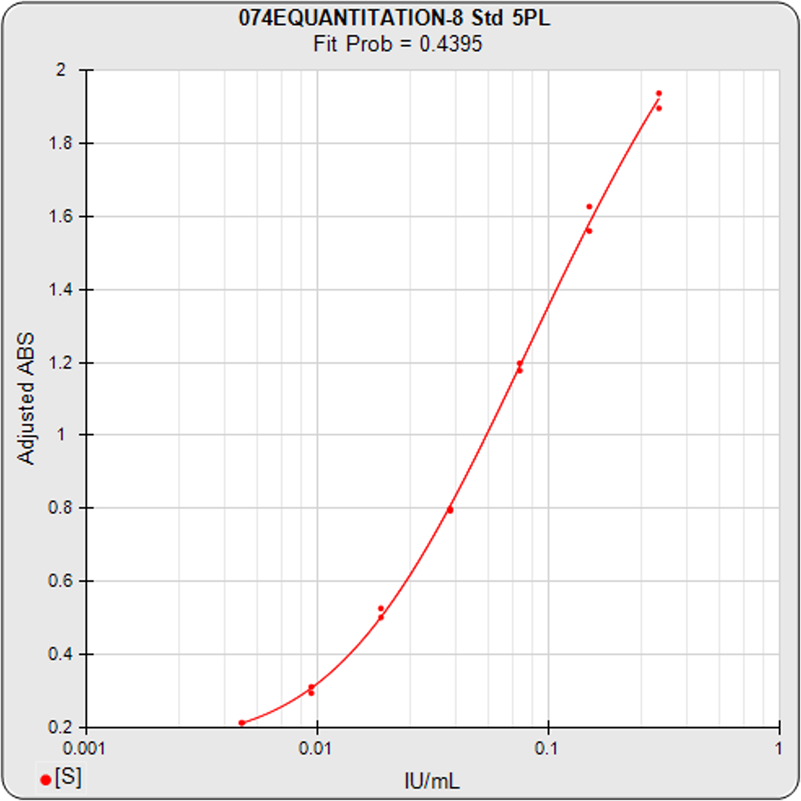
Std Curve
Std Curve
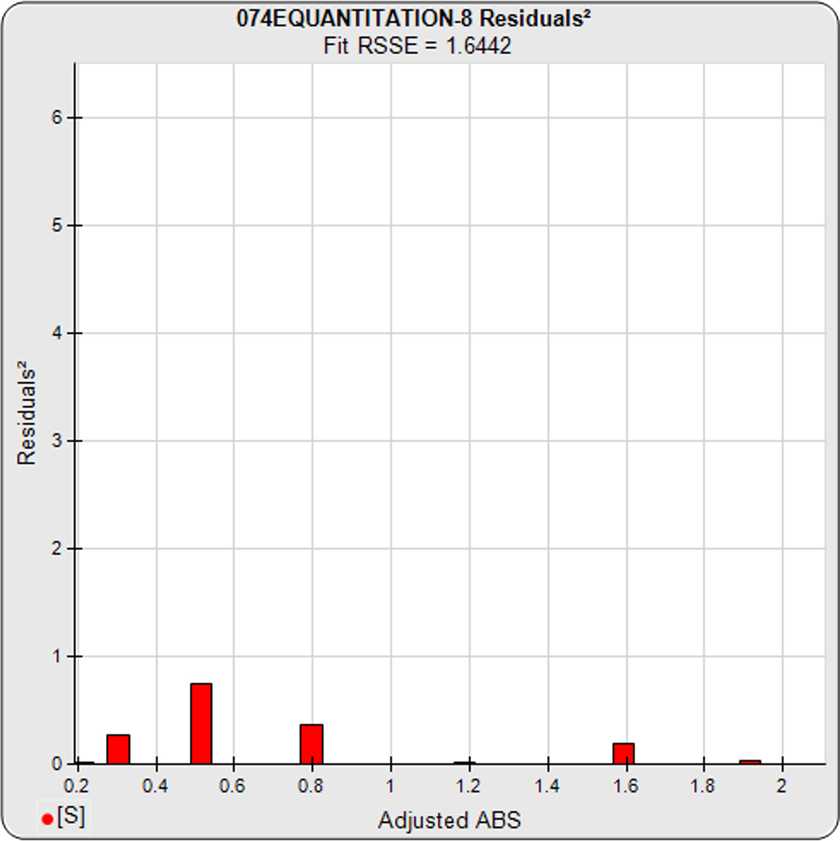
The low squared residual errors (red bars) between the observed responses and predicted responses off the standard curve make it easy to confirm that this is a good curve fit for 5PL or 4PL curves in STATLIA MATRIX 5.0. This is important information that is not clear with just an R2 value and standard curve graph. The accurate curve weighting in STATLIA MATRIX enables the software to provide a reliable, effective squared residual graph with each curve, so you can see how well each dilution fits. There are many more unique graphs and metrics that the software automatically generates to help you determine the reliability, performance and acceptance of your curves, your assays and your unknown results.