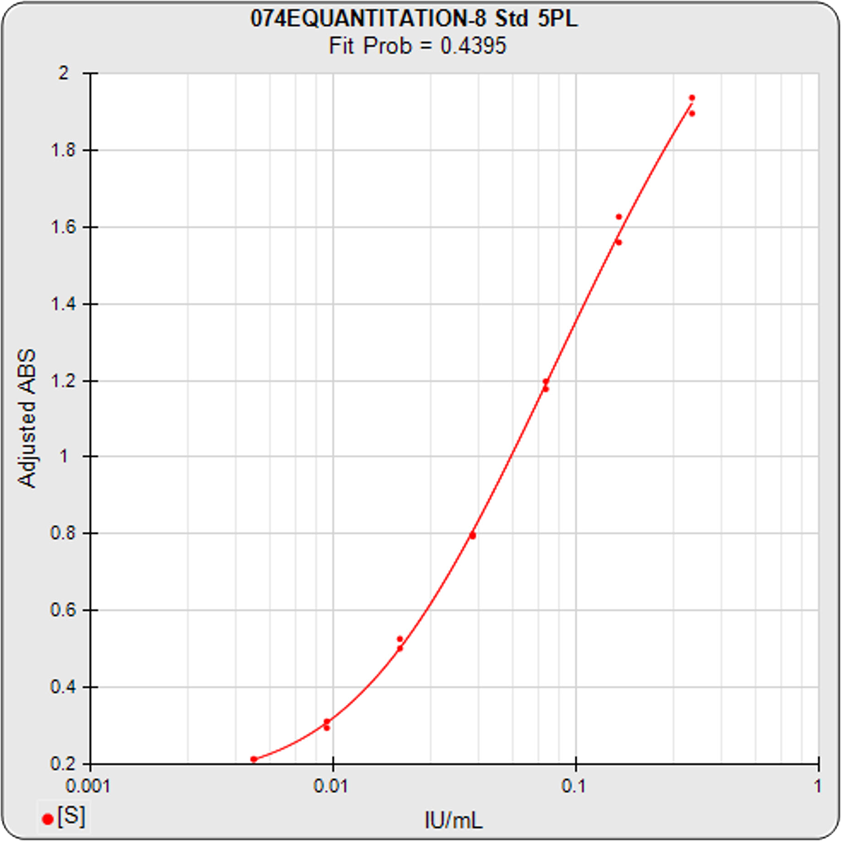
- The high resolution standard curve graph on the left depicts the relationship between responses and doses with the most accurate and robust 5PL, 4PL, and linear regression curve fitting algorithms in the industry.
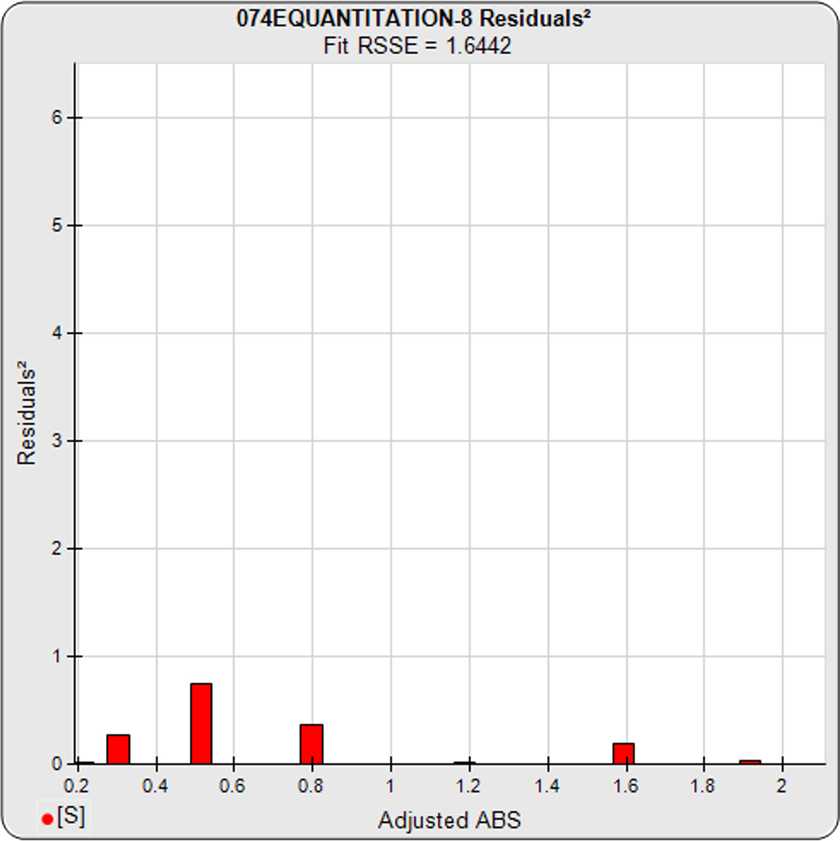
- With the software’s accurate weighting (see Tech Note: Curve Weighting), the squared residual errors (red bars) between the observed responses and predicted responses off the curve should be low for each dilution, as shown in middle graph. A high residual2 indicates a bad dilution.
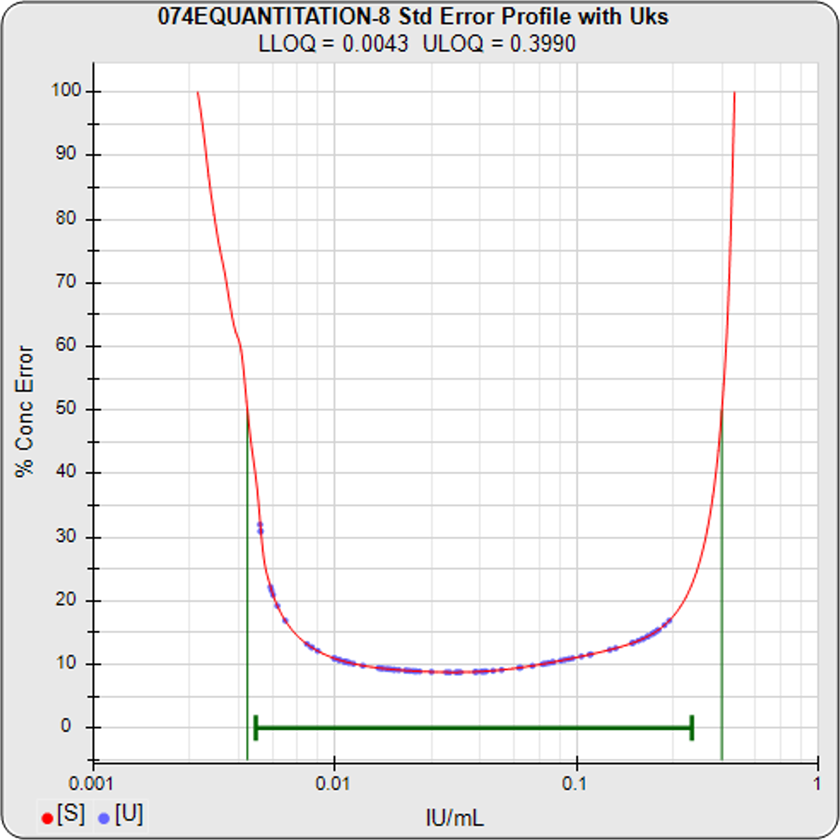
- The graph on the right shows the concentration errors vs. dose of the standard curve in red, with the unknown concentration errors plotted as blue dots. The LLOQ, ULOQ and the reportable range you set for this test method are plotted in green. See the Tech Note: LOQs, LODs on the software’s precision error profile method.