Control Limits
Assay Controls
Limits Established for Control Doses and Responses
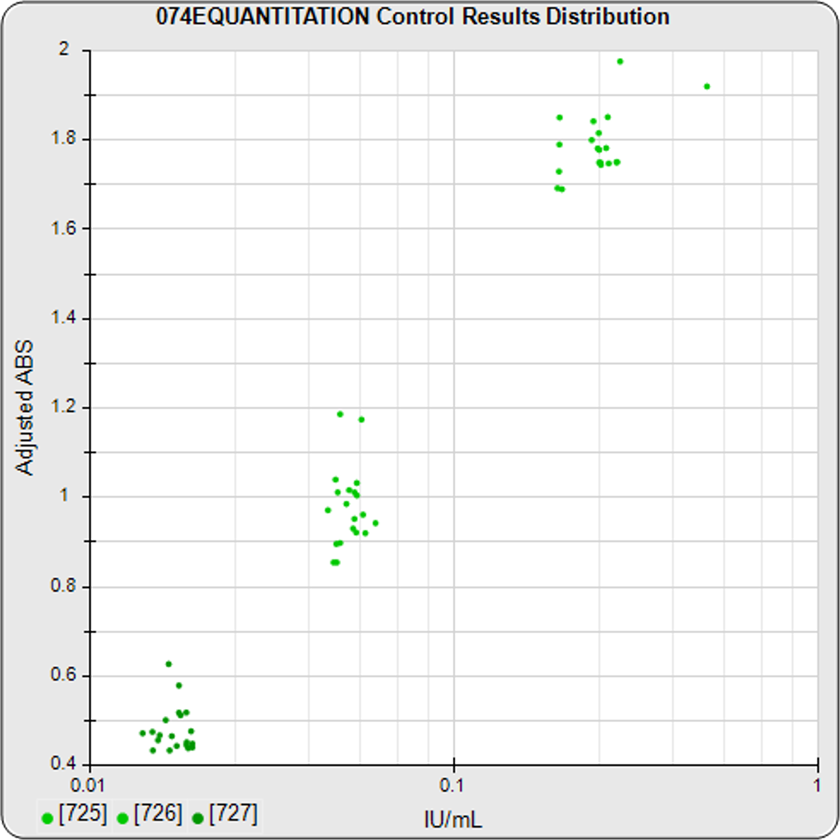
- The response and computed dose of each control from your previously run assays is plotted in the graph on the left in the Performance Analysis report. Confidence limits are computed for the response and dose of each control from these data points, after filtering out any outliers.
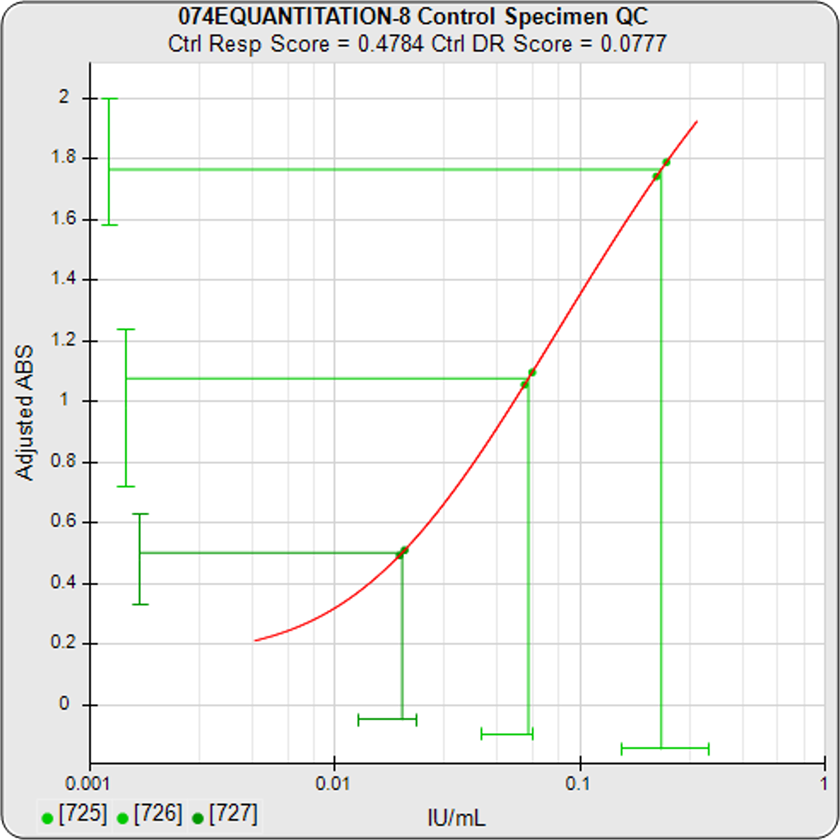
- In the graph on the right, each control response and dose is plotted as a line against its confidence limits in an assay report. The response and dose lines are green when inside their limits, or red when outside. When the response and the dose are both outside their limits, the control itself is bad.