Assay Setup
STATLIA MATRIX’s Many Options Make Setting Up an Assay Intuitive and EasySee your data in STATLIA MATRIX.
STATLIA MATRIX’s Many Options Provide The Flexibility You Want For Your Assay Setup
- Set up most assays in less than 30 seconds. Just enter or import unknown data, choose a detector, and assign a raw data file.
- All assays are stored in the database with their raw data, assay data, settings, and reports for easy tracking.
- The settings for each assay are saved and numbered, so each assay (including modified assays) can be recomputed exactly as it was run.
- The settings are automatically applied to the next assay, and settings can be locked.
- Any settings can be applied to any or all assays.
- Import or cut-and-paste worklists with unknown tracking information.
- Export unknown results with tracking information to LIM system.

96-Well Plates, 384-Well Plates, Test Tube Racks, And Sample Placement
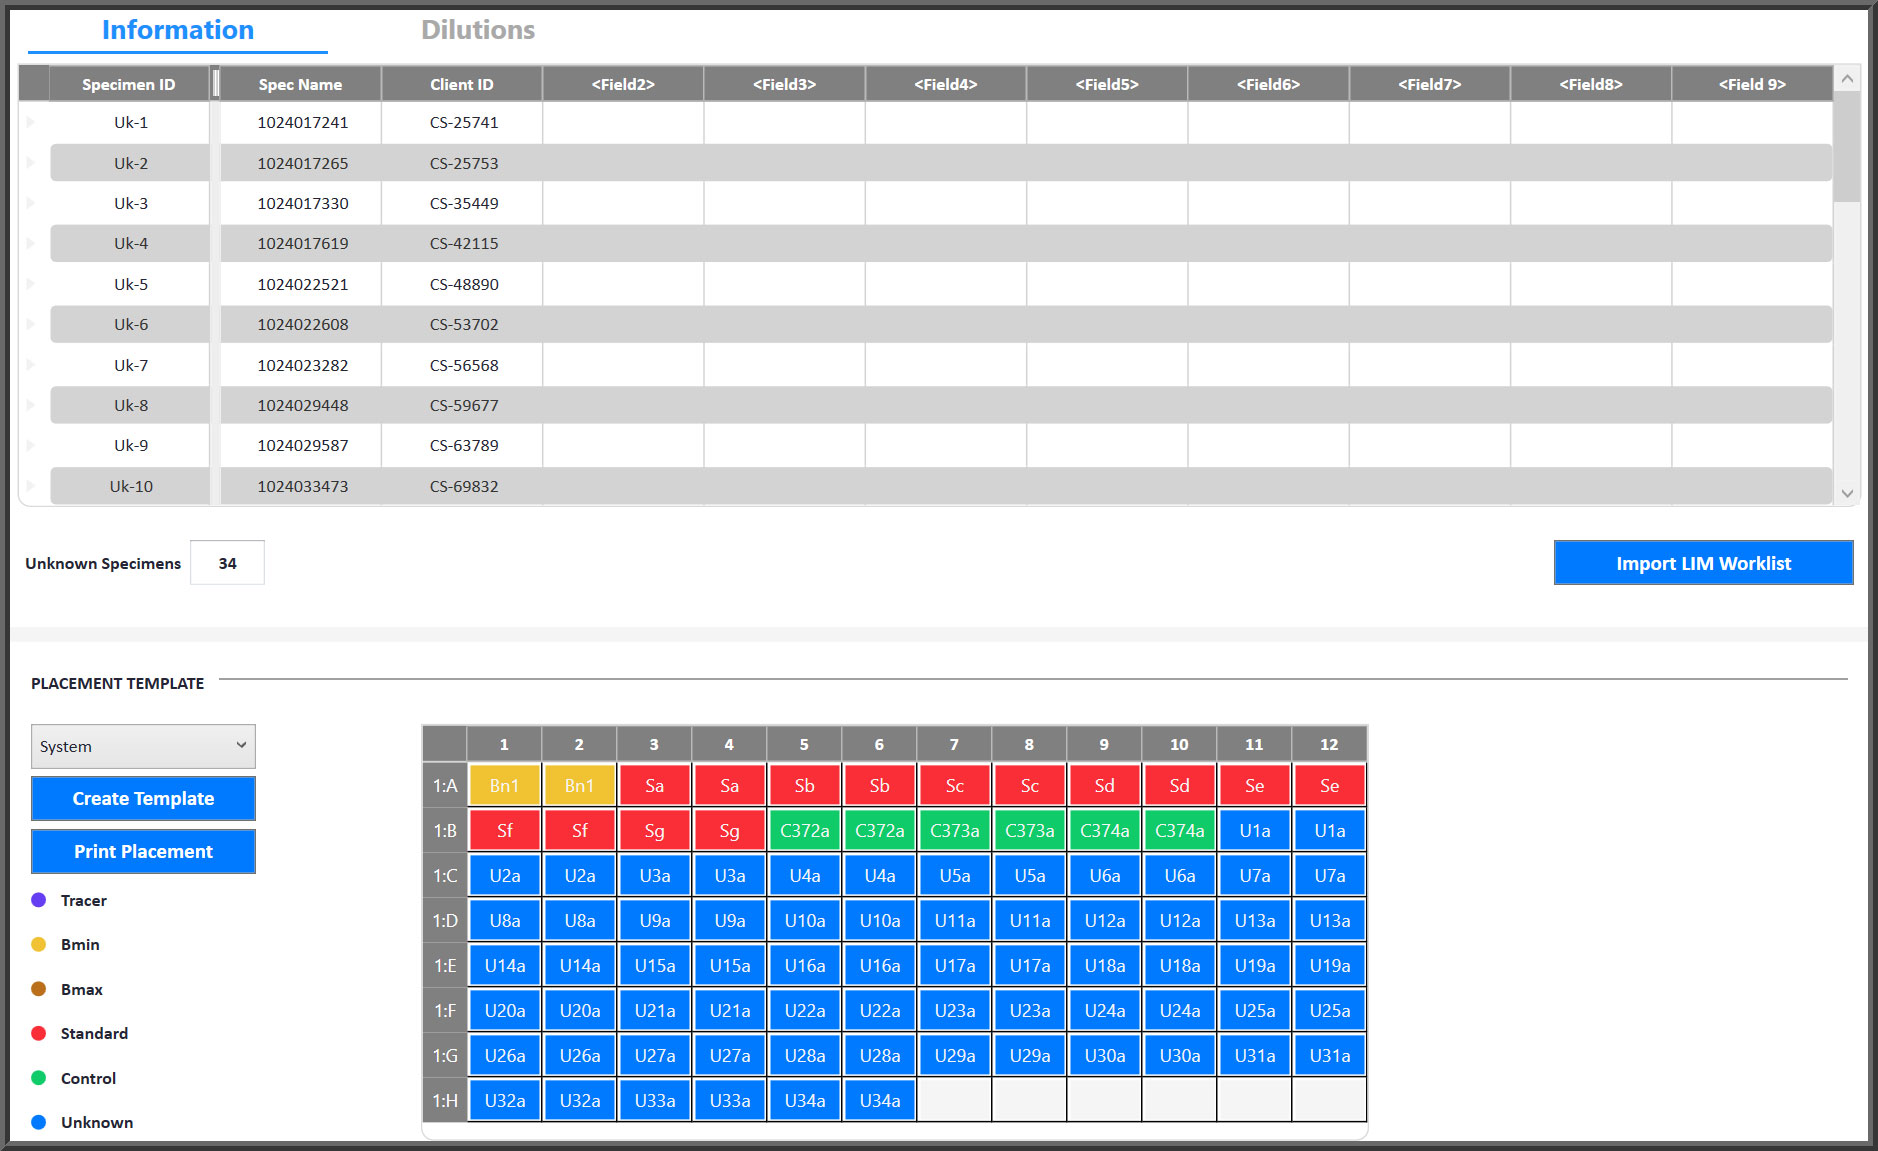
Select A Saved Template Or Create A New One
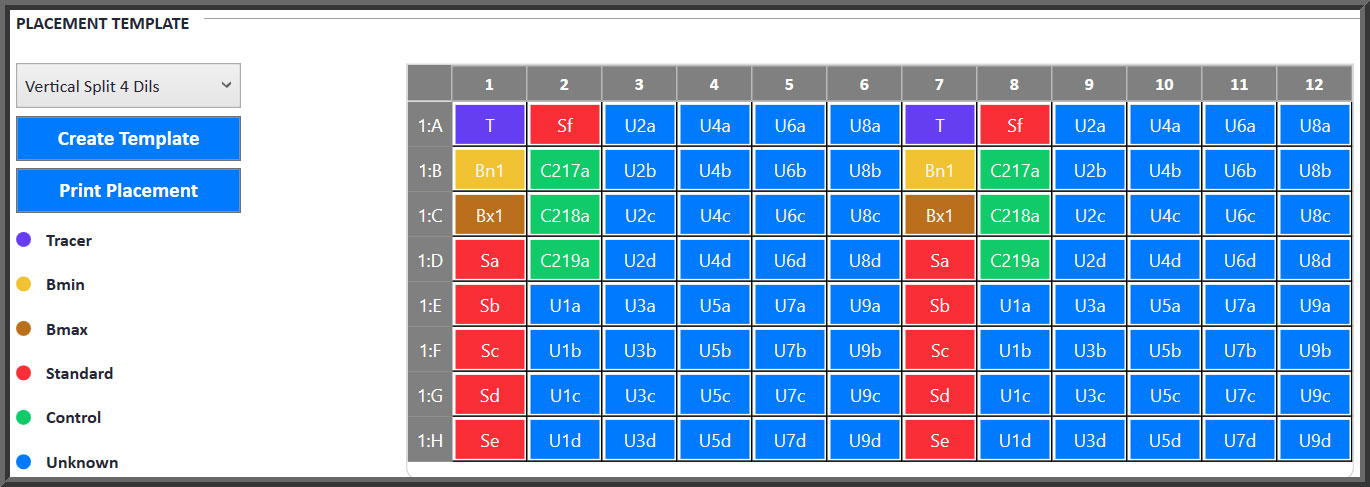
Select A Saved Template Or Create A New One
- All samples are color coded and are placed on the grid automatically according to the selected placement template.
- New templates can be easily created for horizontal, vertical, or custom placements for 96-well plates and 384-well plates.
- Multiple dilutions can be specified for quantitation, potency, and regression tests and are designated in the placement.
- Multiple plate templates can be created for a single assay and multiple assays can be set for a single plate.
- Plate numbers for multiple plates are identified by the grid number preceding the colon and row letter.
Placement Wizard Makes Creating A New Template Quick And Easy
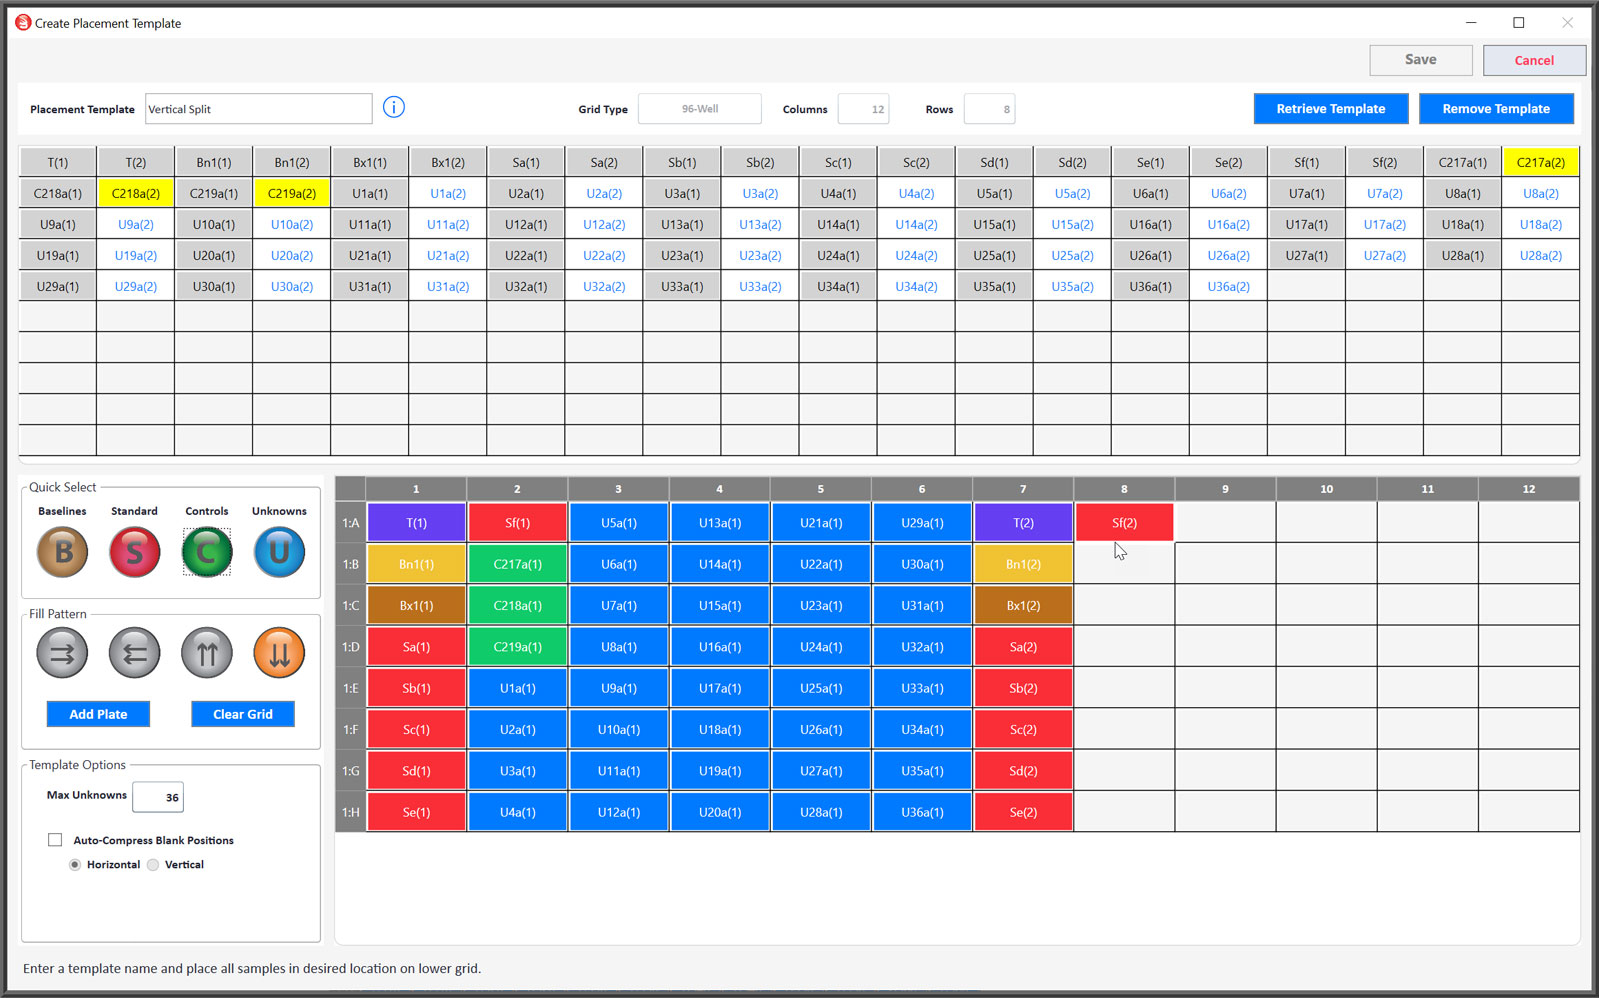
Placement Tool Simplifies Sample Template Creation
- All samples are color coded, dilutions are identified by its letter, and replicates are identified by its number in parentheses.
- Placement grid can be filled using handy Quick Select sample and directional buttons, or placed manually.
- Holding tray shows which samples are being placed now (yellow), which samples are yet to be placed (clear), and which samples have already been placed (gray).
- Existing placement templates can be retrieved to rearrange only a few samples for a new template.
- Number of Columns and Rows can be specified for incubation tube racks when using detectors that read tubes.
Print Your Sample Placement To Guide Your Pipetting
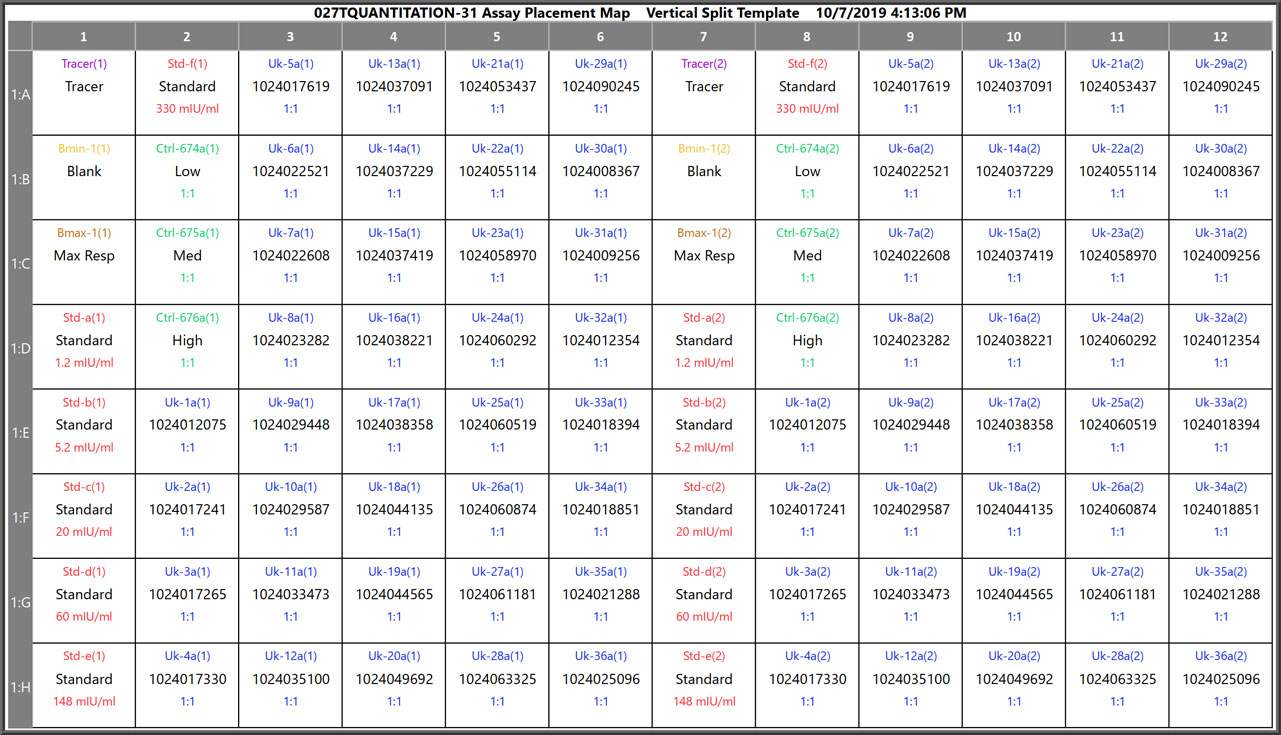
Print Your Sample Placement To Guide Your Pipetting
Each sample cell is color coded by specimen type and lists its Sample ID, its Specimen Name, and its concentration or dilution factor for easy identification while you are pipetting.
Customize Your Grid Size To Match The Test Tube Racks Used For Incubation
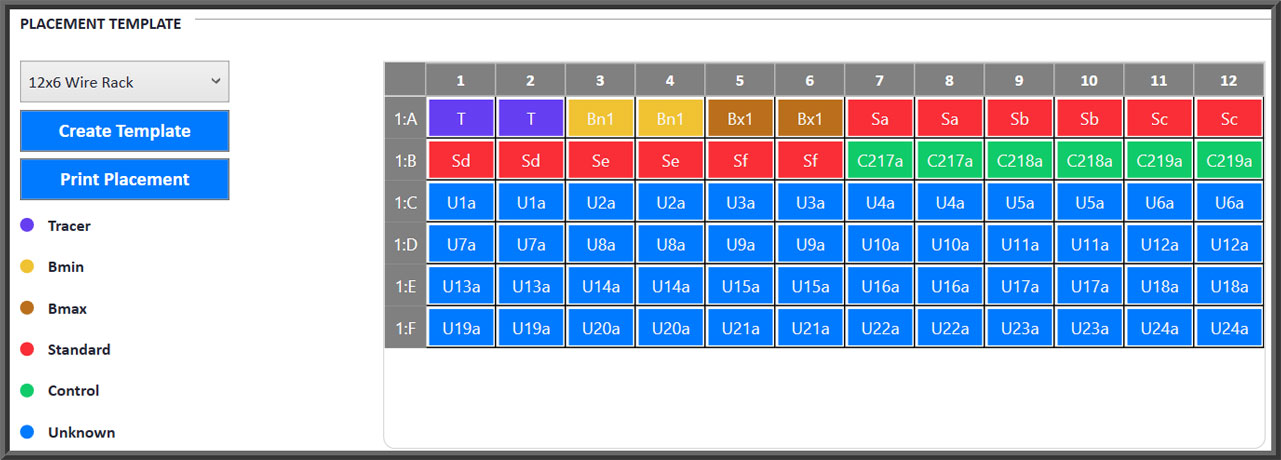
Customize Grid Size to Match Test Tube Racks
- For detector instruments that read tubes instead of plates, the number of columns and rows can be specified to match the tube racks used for pipetting and incubating the assay.
- The assay placement tube locations are automatically mapped to the detector rack layouts of the detector specified.
Edge Effect And Block Randomization Pipetting
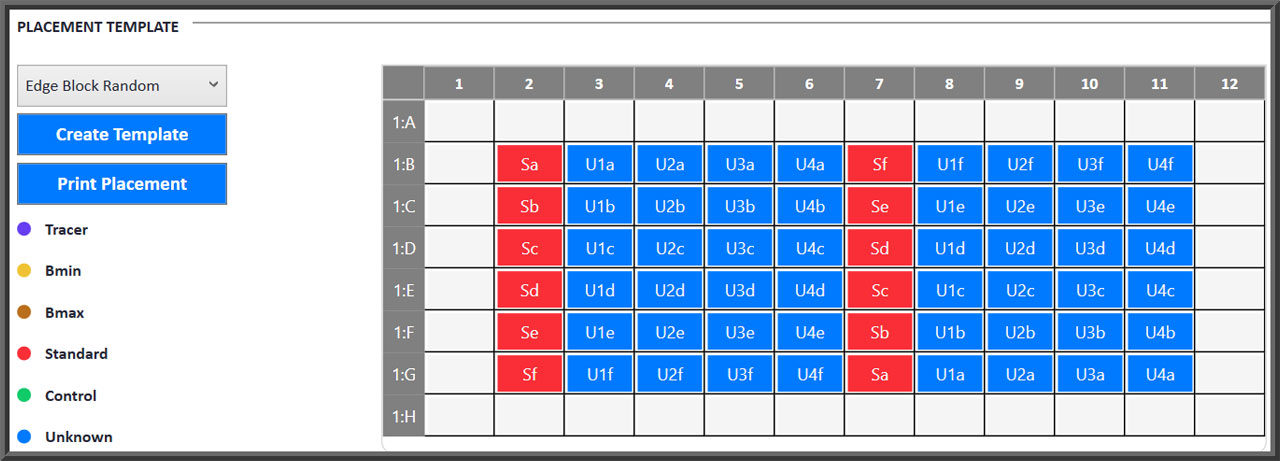
Edge Effect And Block Randomization Pipetting
It has been demonstrated that raw signal measurements are not uniform in all regions of the plate. These small positional effects can disproportionately affect assay results and the reliability of the data. You can reduce the positional bias of your potency assays by creating placement templates in STATLIA MATRIX. One common strategy is to avoid the edge effect by not using outer wells of the plate. Another strategy is to use a block randomization scheme of predefined blocks of a dilution series with each set of single replicates in different locations on the plate and in reversed order.
Edge Effect And Randomization Pipetting
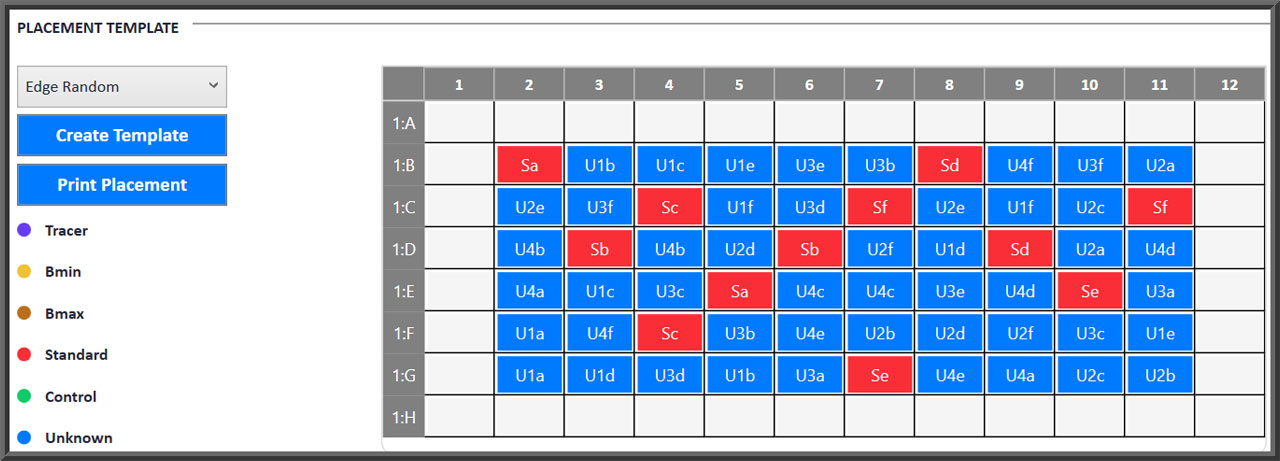
Edge Effect And Randomization Pipetting
It has been demonstrated that raw signal measurements are not uniform in all regions of the plate. These small positional effects can disproportionately affect assay results and the reliability of the data. You can reduce the positional bias of your potency assays by creating placement templates in STATLIA MATRIX. One common strategy is to avoid the edge effect by not using outer wells of the plate. Another strategy is to use a randomization scheme that completely randomizes the placement of all dilutional replicates.
Managing Raw Data From Detector To Assay Is Simple
Select The Instrument For This Assay
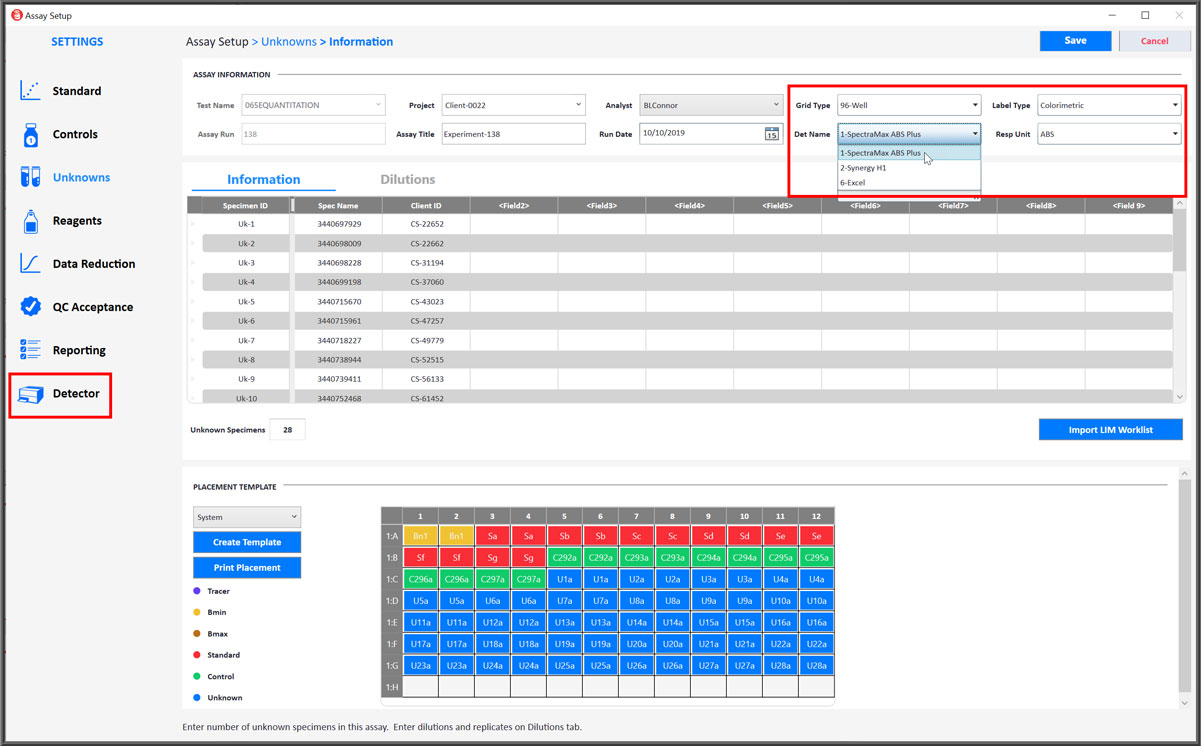
Select The Instrument For This Assay
- A detector can be selected when setting up an assay, or at a later time when a detector becomes available.
- Only detectors that match the grid type and label type are displayed.
- All responses from the raw data files are expressed in the response units selected for that test.
- Assays can be set up and saved before the raw data is collected whether or not a detector has been selected.
Select The Raw Data File For This Assay
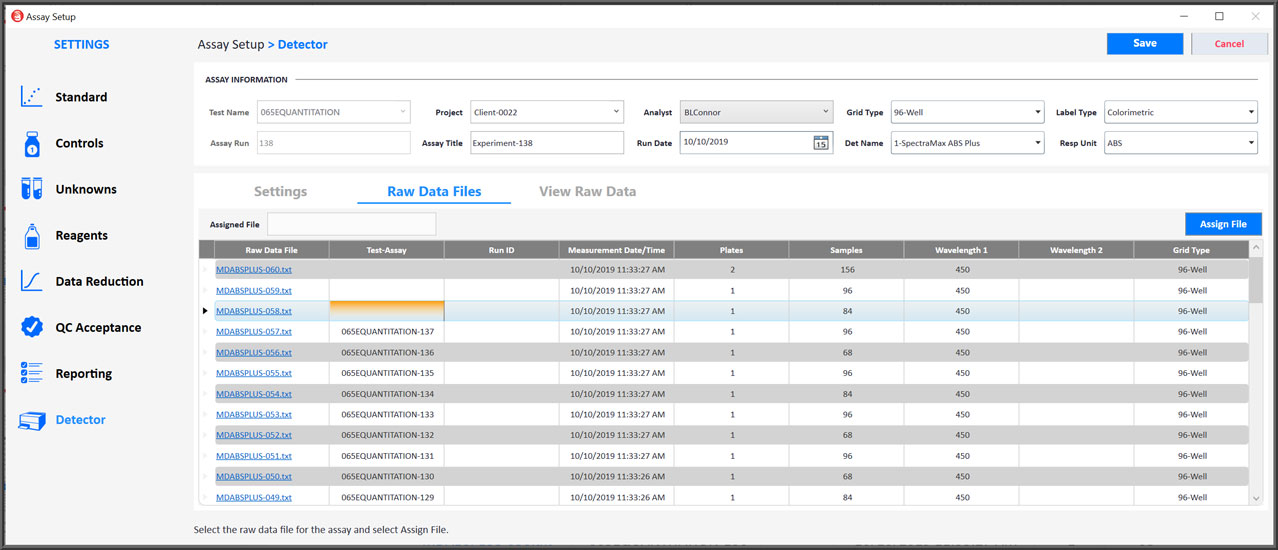
Select The Raw Data File For This Assay
- Any raw data file from that detector may be assigned to any assay if the settings and number of samples match those of the assay.
- All raw data files can be viewed, copied, or printed by clicking the link at any time. Raw data files cannot be modified or deleted.
- Raw data files can be assigned to additional assays for dual labeled tests or reassigned to an assay to address assay setup changes.
- After a raw data file is selected for an assay, it is tracked with the assay in the database.
View Your Raw Data With The Sample Placement
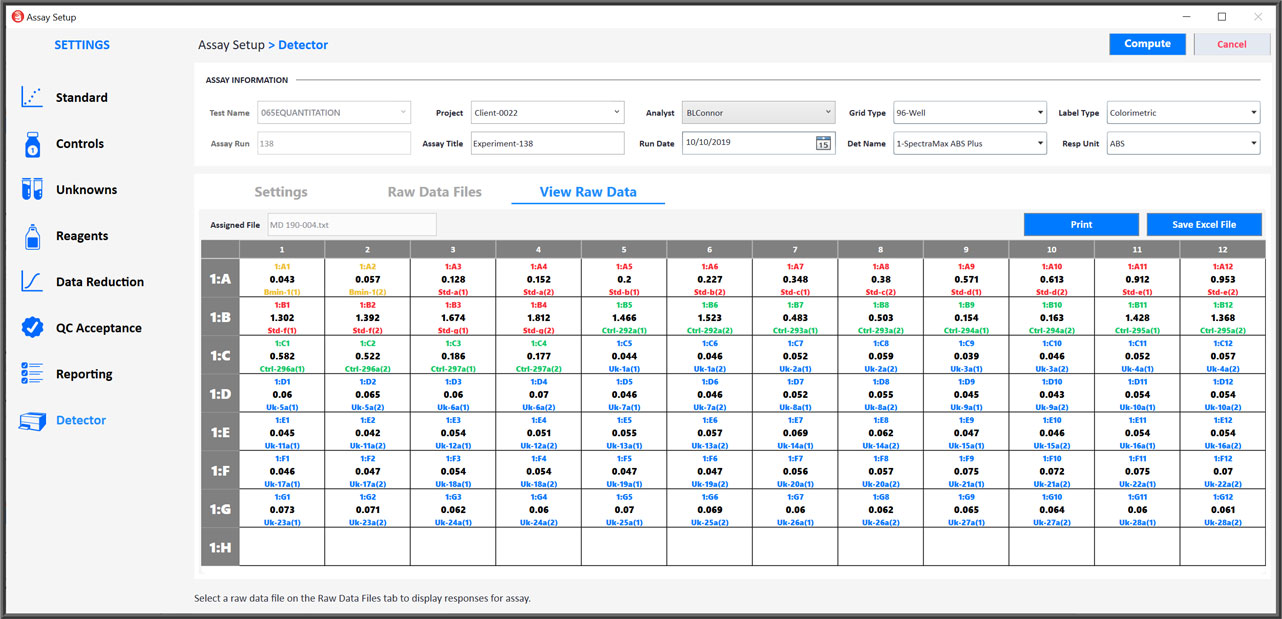
View Your Raw Data With The Sample Placement
- Raw data files can be viewed matched with the color-coded identification information of each sample.
- These raw data placement templates can be printed for a permanent record of sample placement.
- Raw data can be exported to Excel files with sample placement in one grid and matching raw data responses in another grid.
Download Unknown Worklist From LIM Or Copy And Paste ID Information From Spreadsheet
- Unknown information can include the identification, study or project number, client ID, description, or other fields defined by your laboratory.
- You can use the LIM Worklist button to import a worklist file downloaded from your LIM system.
- You can copy and paste the unknown information from a spreadsheet.
- You can manually enter the information.
Dilution Wizards For Easy Standard, Control, And Unknown Dilution Setup
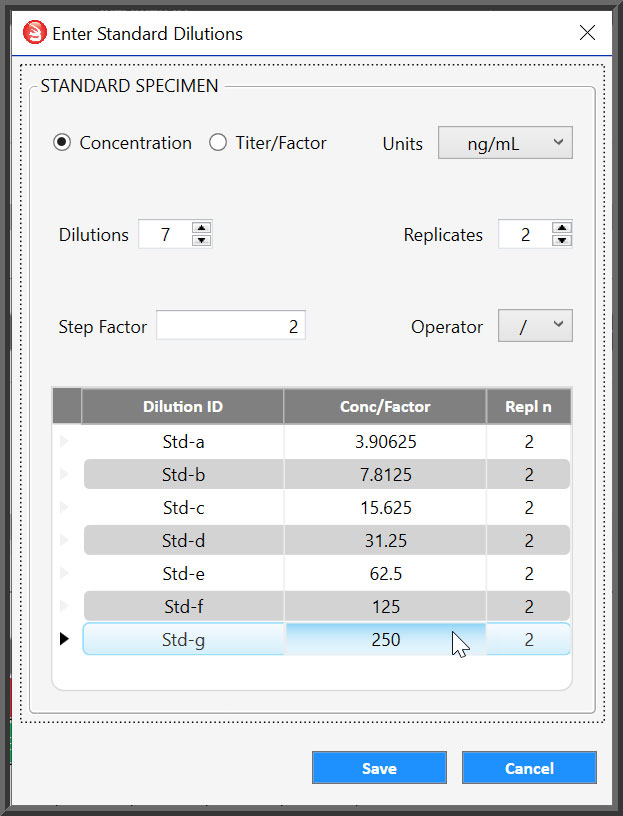
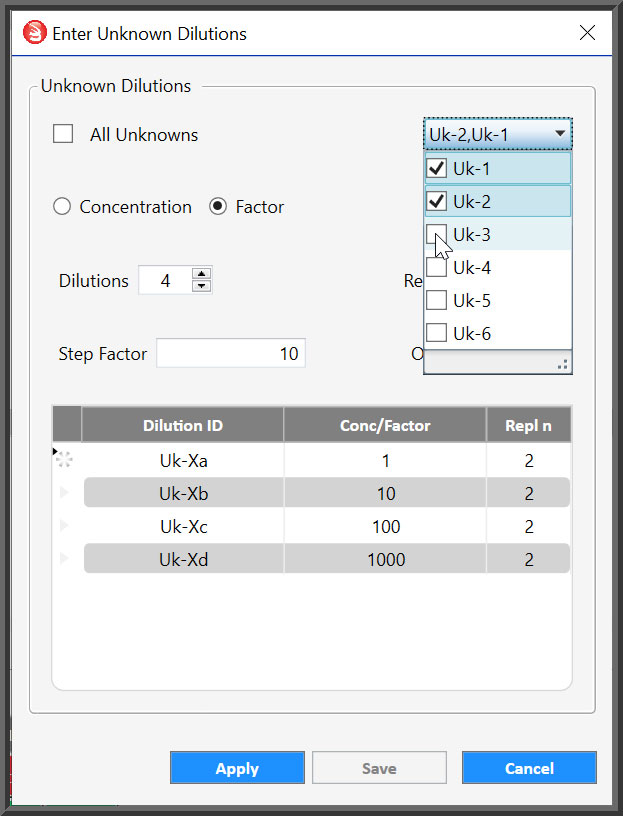
- Concentration units or titer can be used for the standard curve.
- Concentration or factors can be entered, copy and pasted, or entered by the software using the Step Factor and Operator in the dilution wizard.
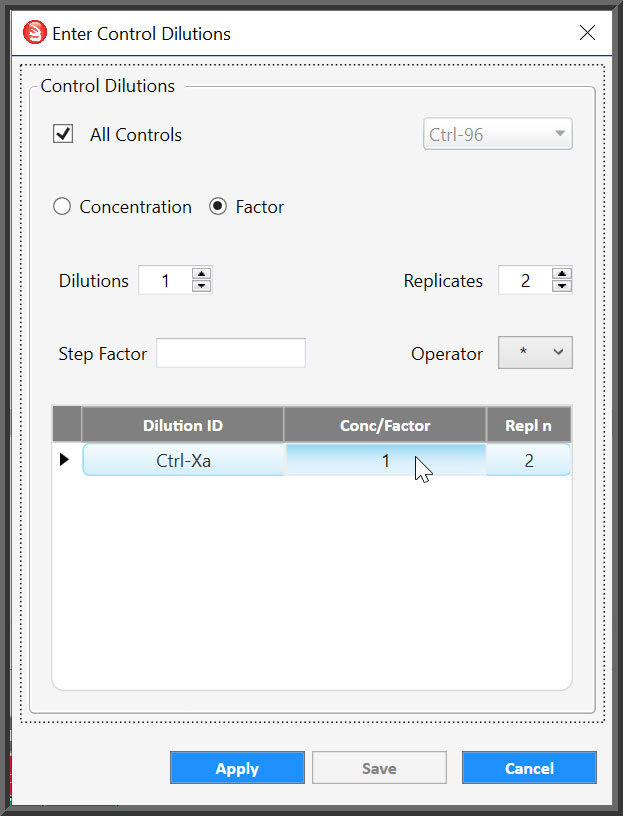
- Concentrations or dilution factors can be used for controls and for unknowns. The software automatically converts concentrations to factors and visa versa so either can be used as appropriate.
- Controls and unknown dilutions and replicates can be entered individually for each control and unknown or entered once for all controls and unknowns.
Tailor Your Reporting For Your Laboratory And Clients
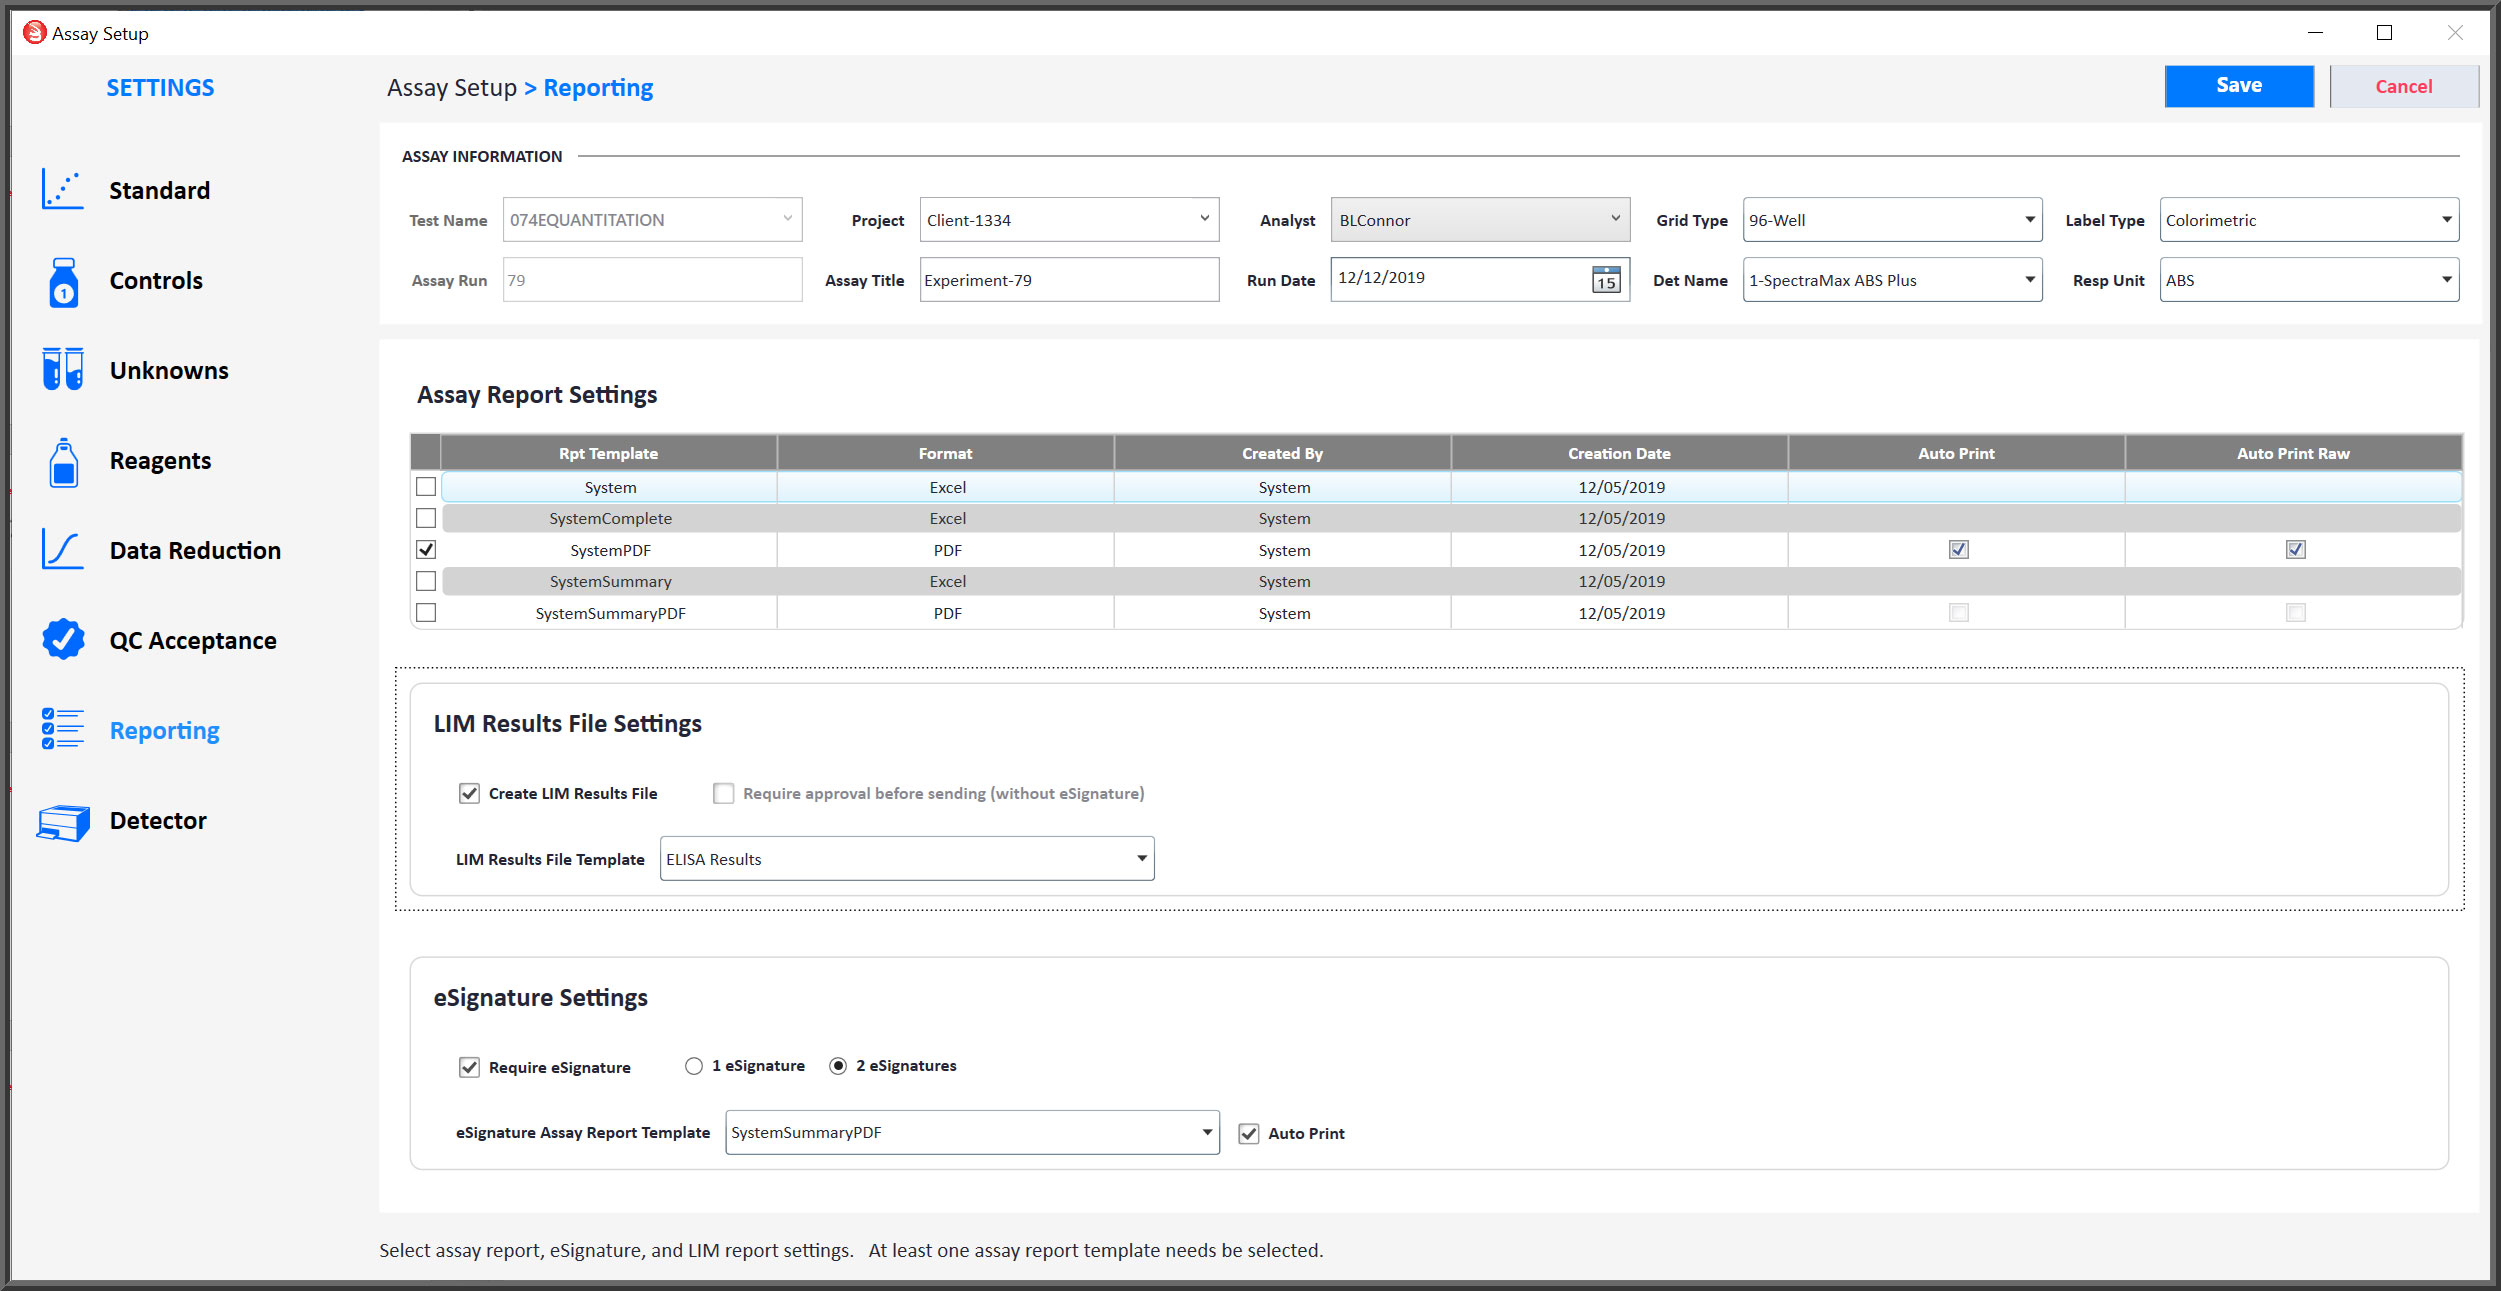
- Assay report templates can be those provided with the system or report templates customized by your laboratory.
- PDF templates can be automatically sent to a printer, along with the raw data file from the detector.
- Exporting LIM Results, with or without approval, can be set individually for each test method.
- Each test method can be set up for one or two eSignature approvals with individually designated templates for the signed report.
Automatically Mask Outlier Samples Or Ignore Samples Manually
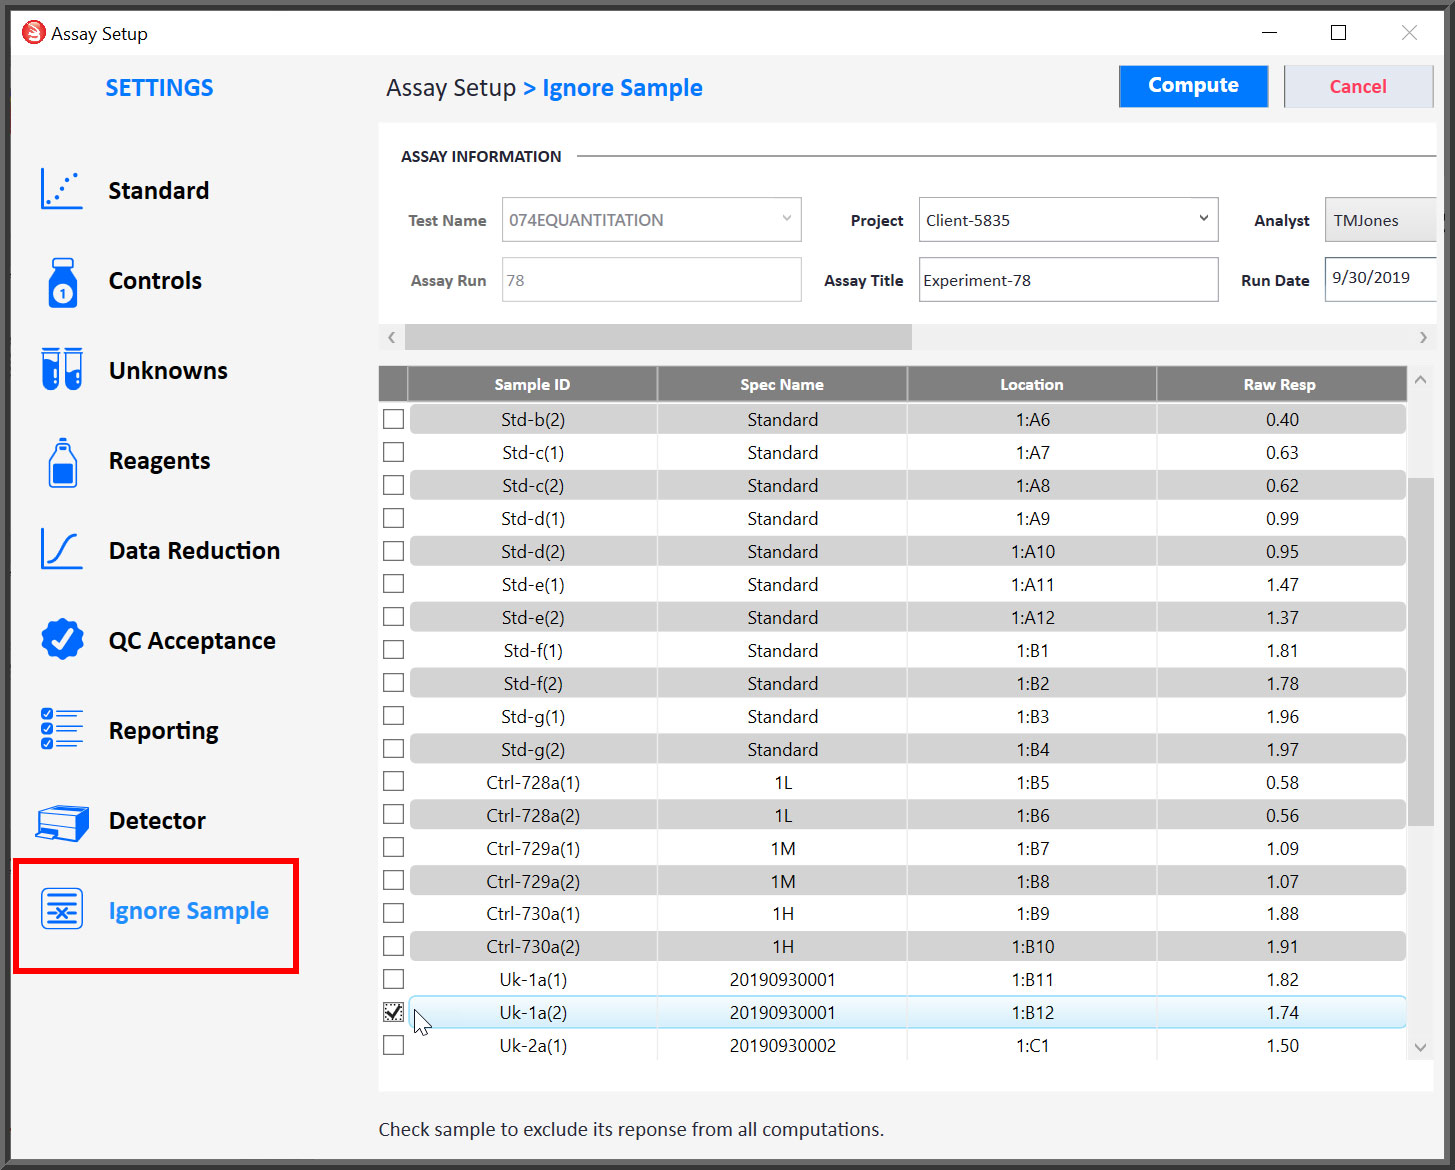
- All precision and residual outliers are identified by the software and can be masked automatically.
- Whether or not automatic masking is specified, you can manually ignore a sample by selecting that assay in Previous Assay on the main screen, then check the sample(s) in the Ignore Sample table.
- Some detectors can flag certain samples as unreadable. These samples are recorded as Ignored by Detector in the database.
- Any sample that has been automatically masked or manually ignored is excluded from all computations.
- Precision (red), residual (blue) and manually or detector ignored (gray) samples are color coded in the assay reports for traceability.
Run, Track, And Compare Blanks And Other Baseline Samples
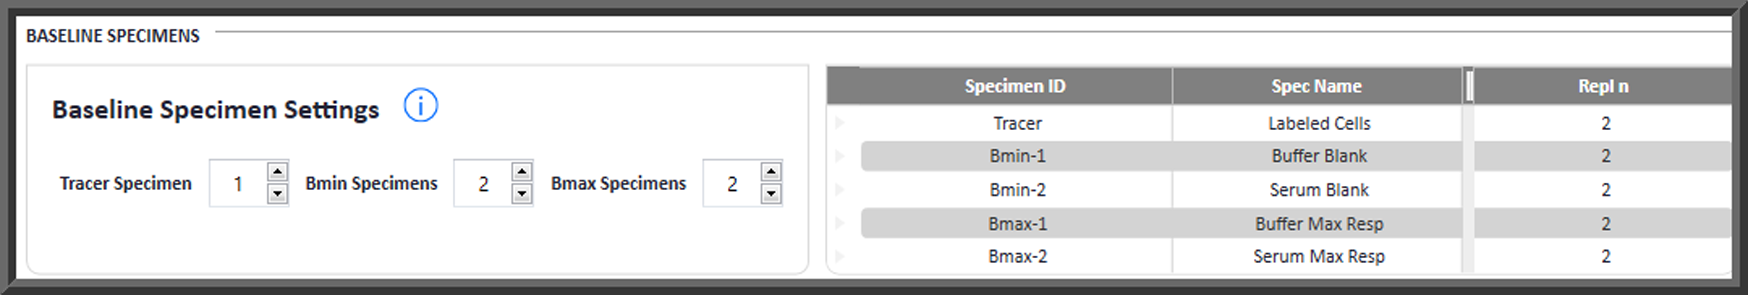
- You can run blanks and other types of baseline samples with your assays. The software will automatically track those samples and compare them to matching samples from pooled assays.
- You can run a tracer, which allows the software to adjust the sample responses to remove the assay to assay differences in the label signal, differences that do not affect the assay kinetic reactions of the samples. Adjusting for a tracer has no effect on the assay results.
- A Bmin such as a blank or nsb is a baseline sample that produces the minimum response in the absence of any assay kinetic reaction. If different matrixes are present, such as buffer for standard dilutions and serum for unknown test samples, separate Bmins can be run, assessed, and compared to their respective pooled assay performance.
- A Bmax such as a B0 or max bind is a baseline sample that produces the maximum response in the absence of any analyte. If different matrixes are present, such as buffer for standard dilutions and serum for unknown test samples, separate Bmaxs can be run, assessed, and compared to their respective pooled assay performance.
There Are Many Guides To Assist You Throughout The Software
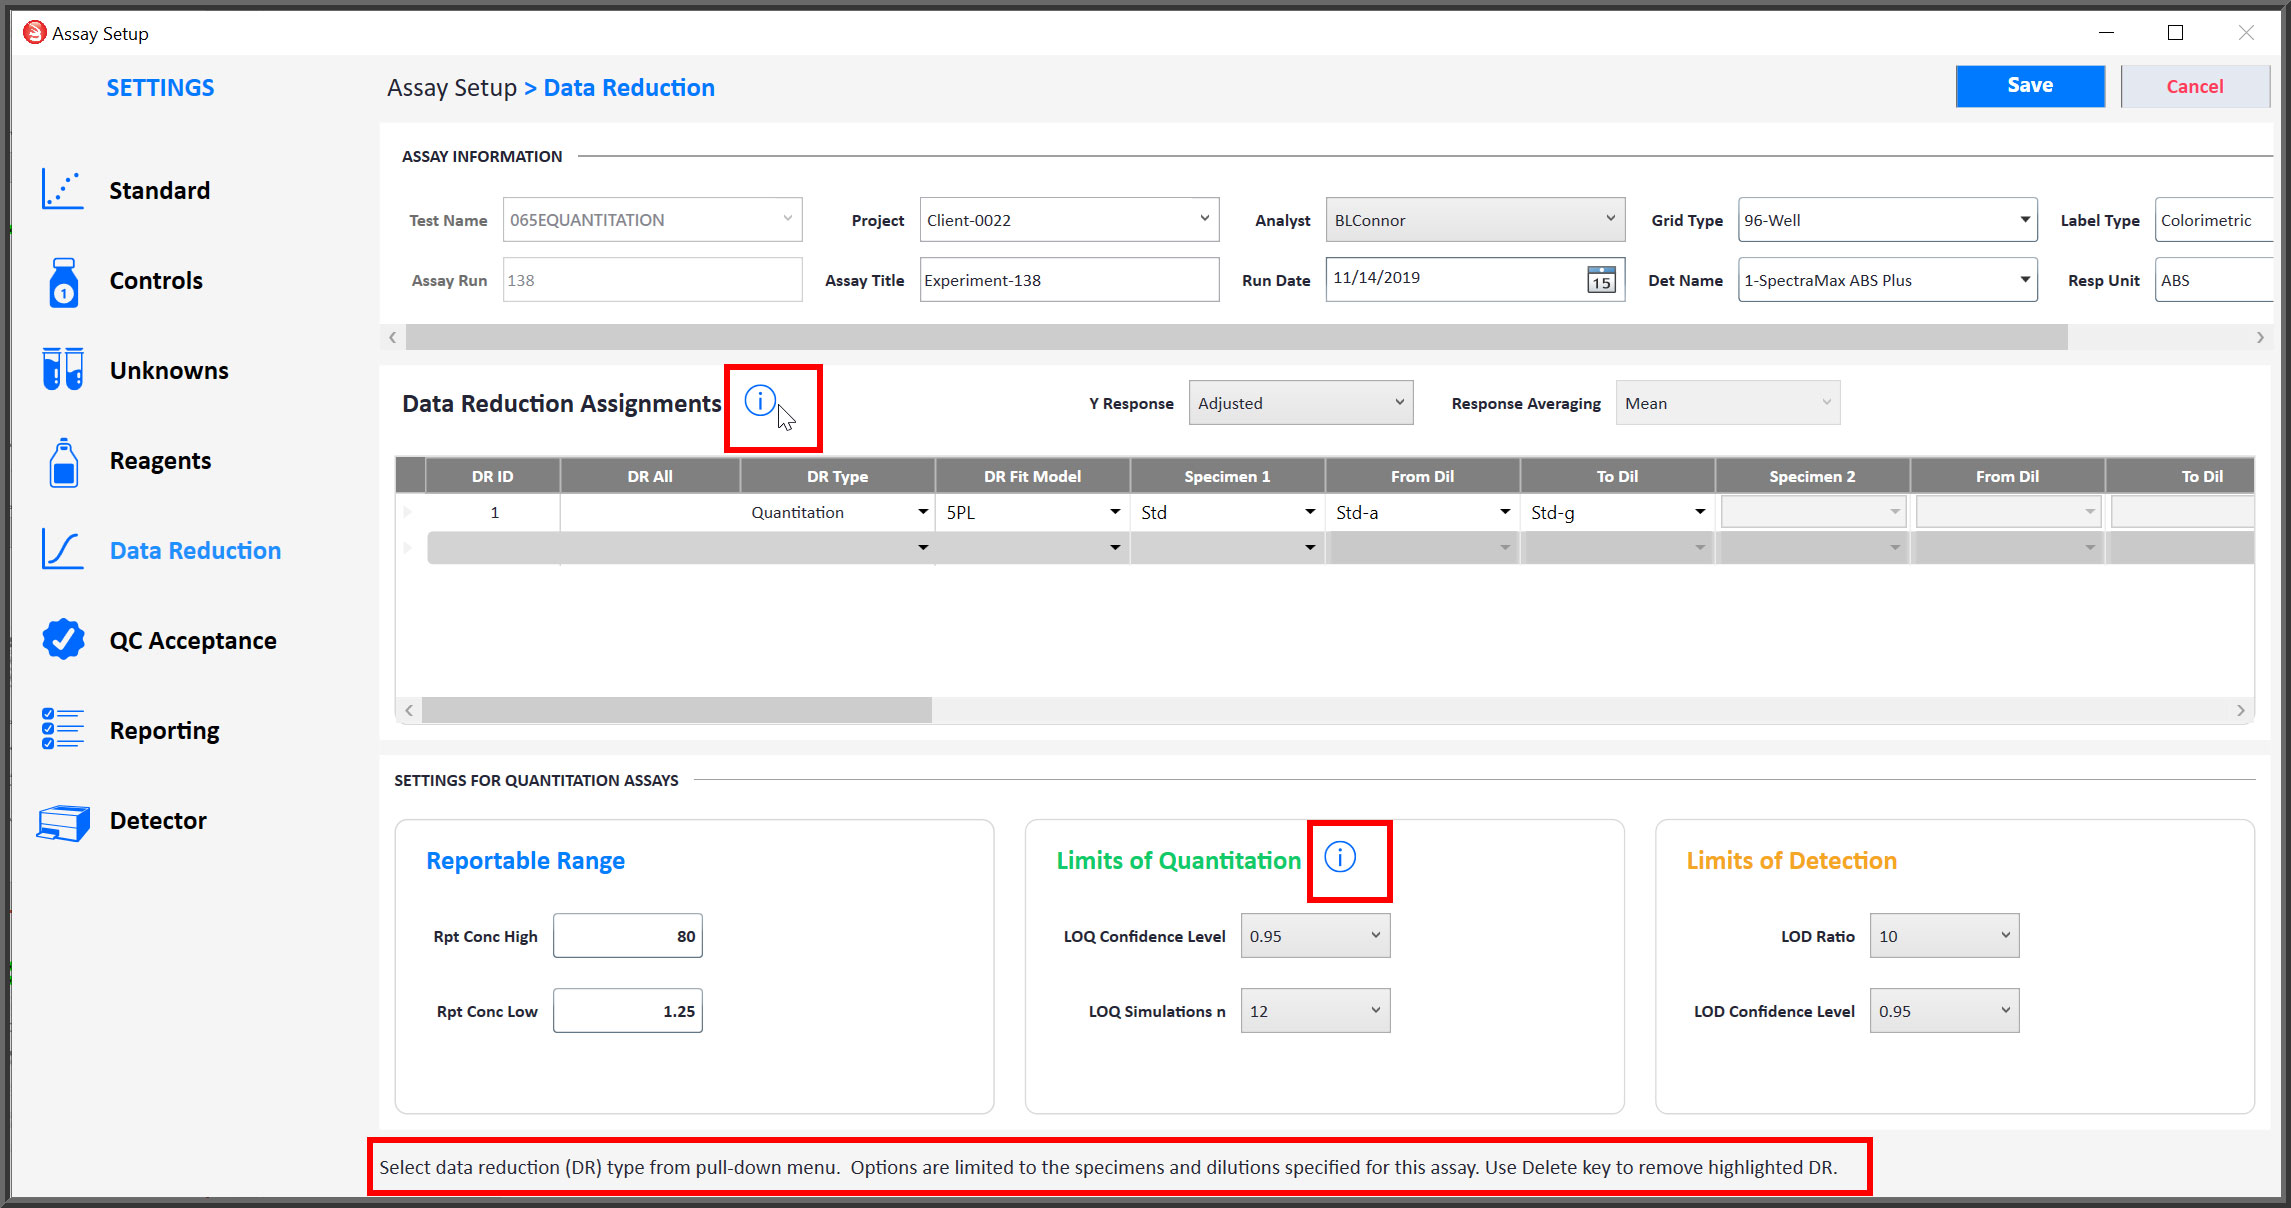
- Click any circled blue I and an information window will open with more details about that section.
- Prompts are located at the bottom of every screen with information about that screen.
- Some sections are color-coded with information about each section conveniently located on the screen.
- The extensive User Guide contains step by step instructions, information, and illustrations for easy reference.
- The informative online tutorial steps you through setting up an assay, reviewing the different report types, and additional options in the software.