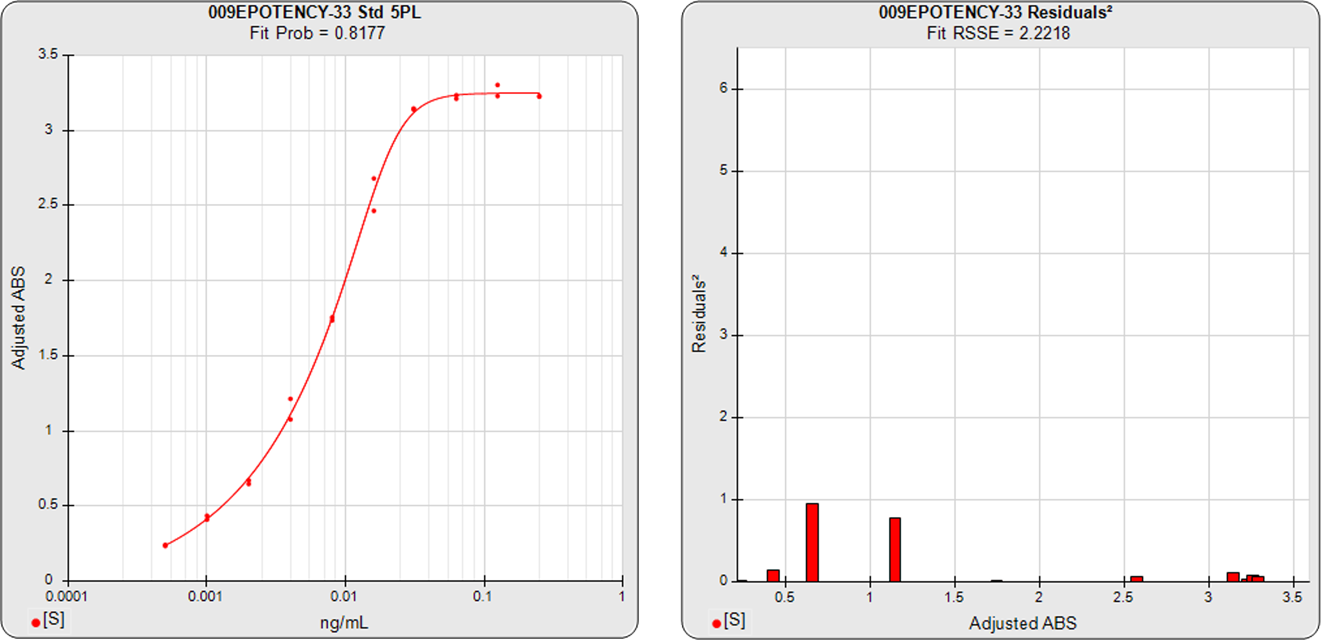
Asymmetric Curves
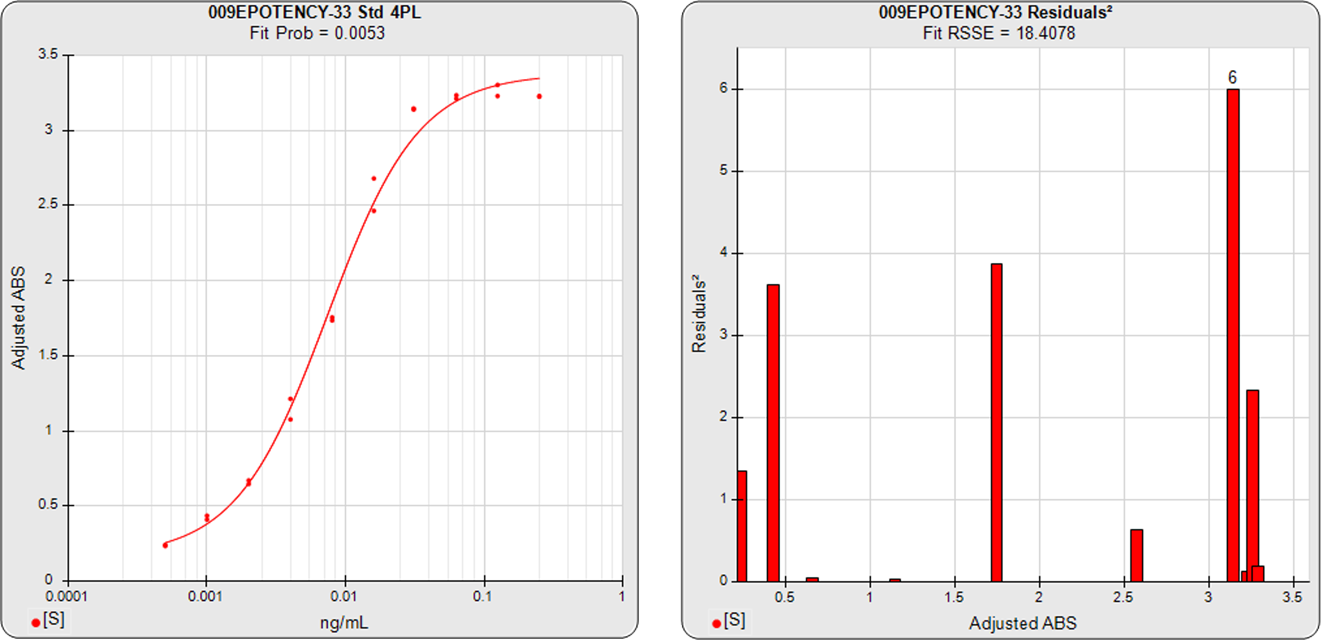
Many bioassay curves are too asymmetric to be fit accurately with the symmetric 4PL, like the bioassay above. The 5PL curve and dilution squared residuals (left two graphs) and the 4PL curve and dilution squared residuals (right two graphs) were computed using the same data. The dilution squared residuals graphs show the squared residual errors (red bars) between the observed responses and predicted responses off the curve divided by their estimated variance for each dilution of that curve. See Tech Note: 5PL and 4PL Curve Fitting for more information.
These bad fits at the upper and lower ends of the 4PL curves show why bad fits affect parallelism and potency results. STATLIA MATRIX’s 5PL is the gold standard in analysis software and will easily fit your assays’ curves whatever their shapes. The manuscript: The Five Parameter Logistic: A Characterization And Comparison With The Four Parameter Logistic, has been requested over 5.000 times and been cited more than 300 times. STATLIA MATRIX is the industry software with the best weighting to meet the FDA guidelines for “appropriate weighting”. See the Tech Note: Curve Weighting for more information.
Recent Comments