Quantitation Assays
Run ELISA, ECL, EIA, FIA, LIA, RIA, and Label-Free Assays On All InstrumentsEasily Set Up, Analyze and Manage Your Quantitation Assays
- Gold standard 5PL and 4PL curve fitting
- Accurate weighting computed from your pooled assays
- Weighted average result computed from multiple dilutions
- Mask outliers automatically with detailed justification
- Run concentrations or titers
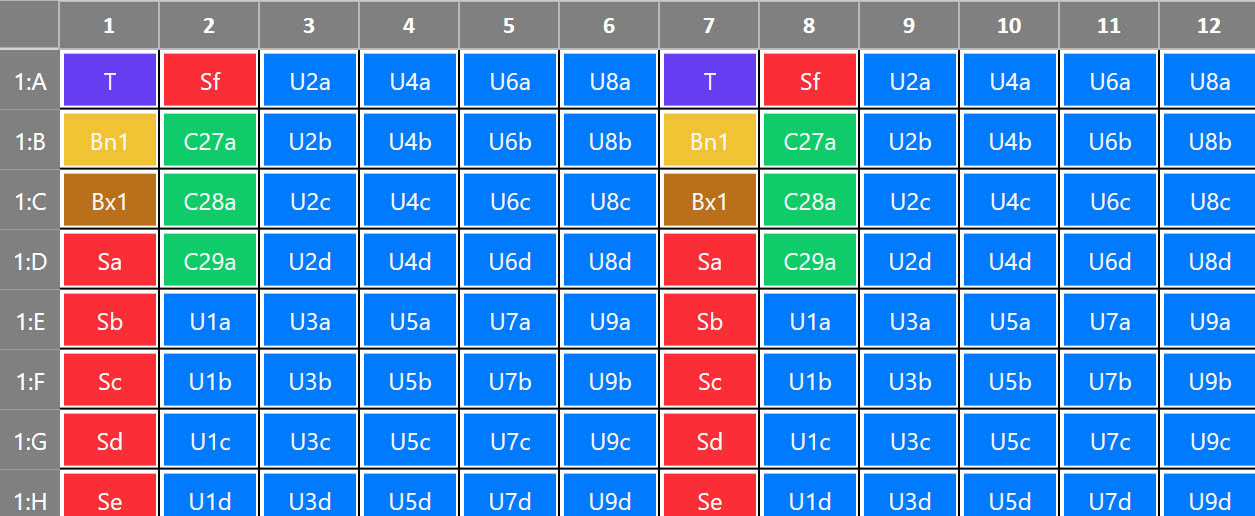
- Dilution wizards and placement wizard makes setup easy
- Placement templates stored
- Color coded placement printouts
The Industry Leading Gold Standard For 5PL
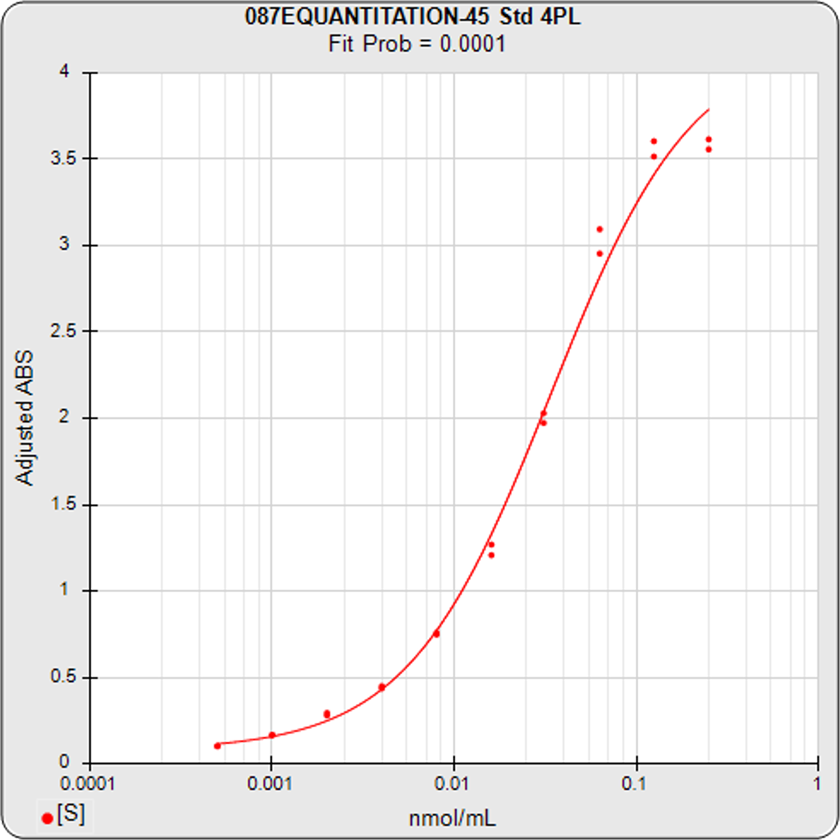
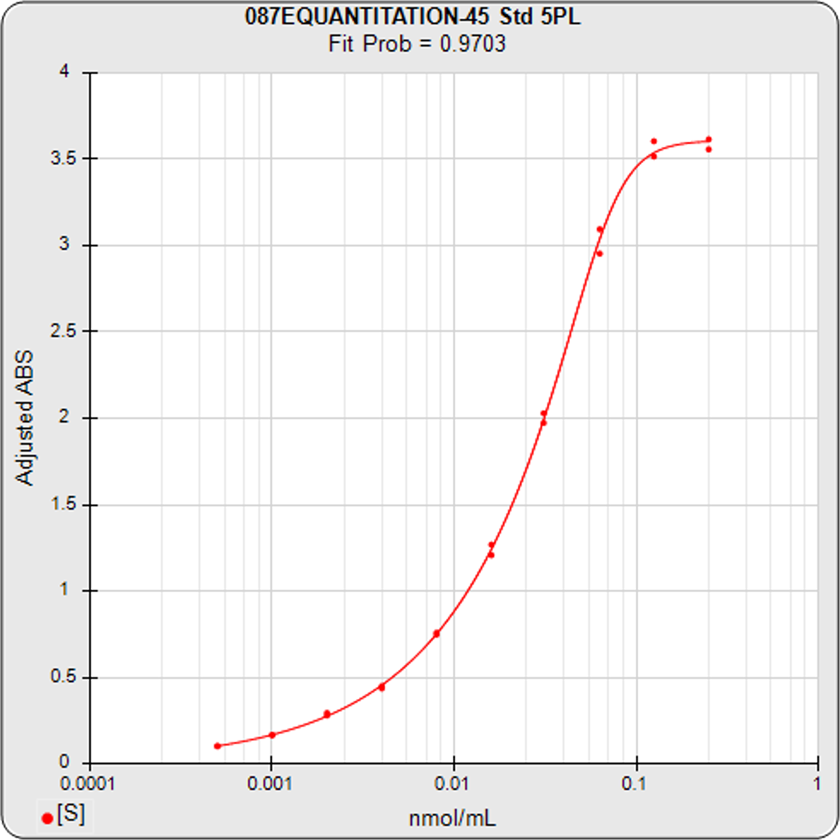
Asymmetric Curves
Many dilution curves, especially ELISA curves, are too asymmetric to be fit accurately with the symmetrical 4PL. These bad fits at the upper and lower ends of the curves can significantly affect concentration results. STATLIA MATRIX’s 5PL is the best in the industry and will easily fit your assays’ curves whatever their shapes. The manuscript on the software’s weighted 5PL model has been cited more than 300 times. STATLIA MATRIX is the only industry software with the appropriate weighting cited in FDA guidelines.
Informative Graphs Highlight the Performance of Quantitation Assays
How Good Was Your Curve?
Std Curve
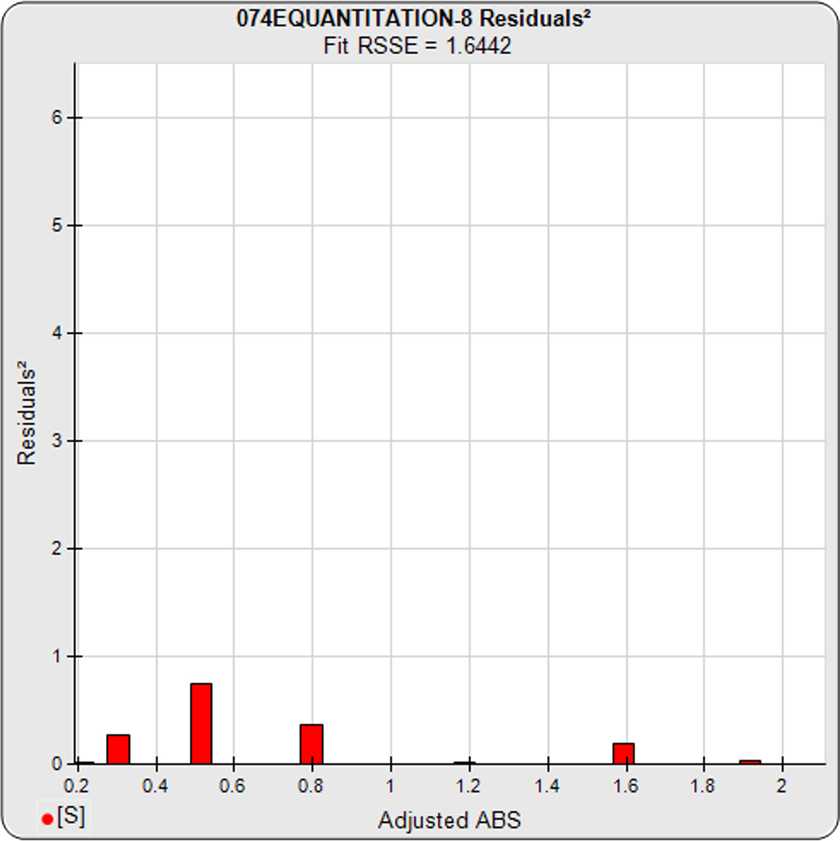
Std Residuals²
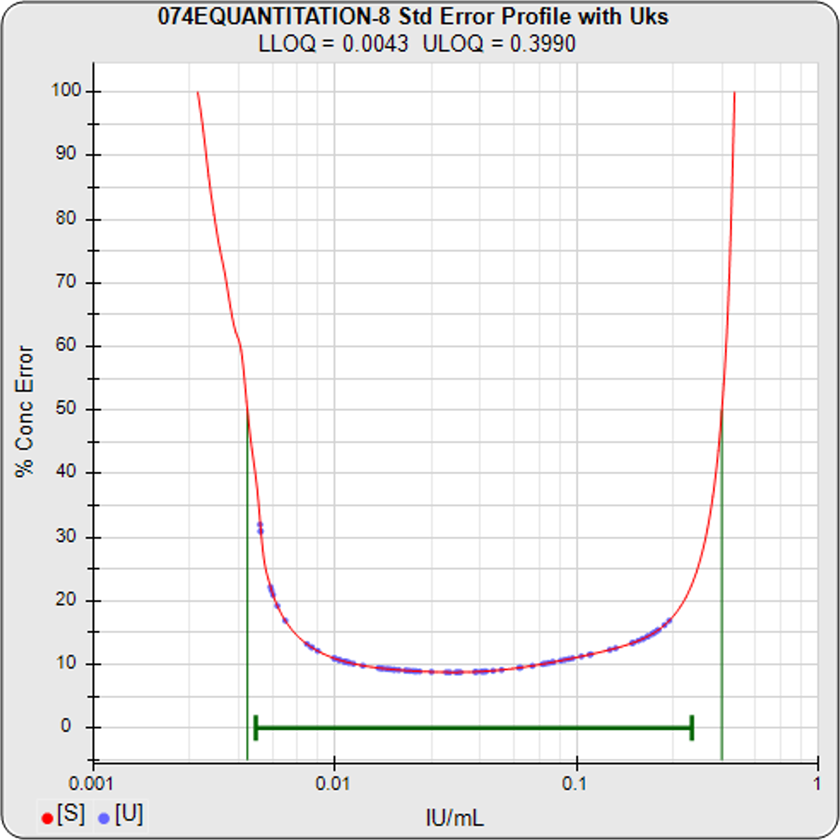
Conc Precision Error
How Good Is Your Curve?
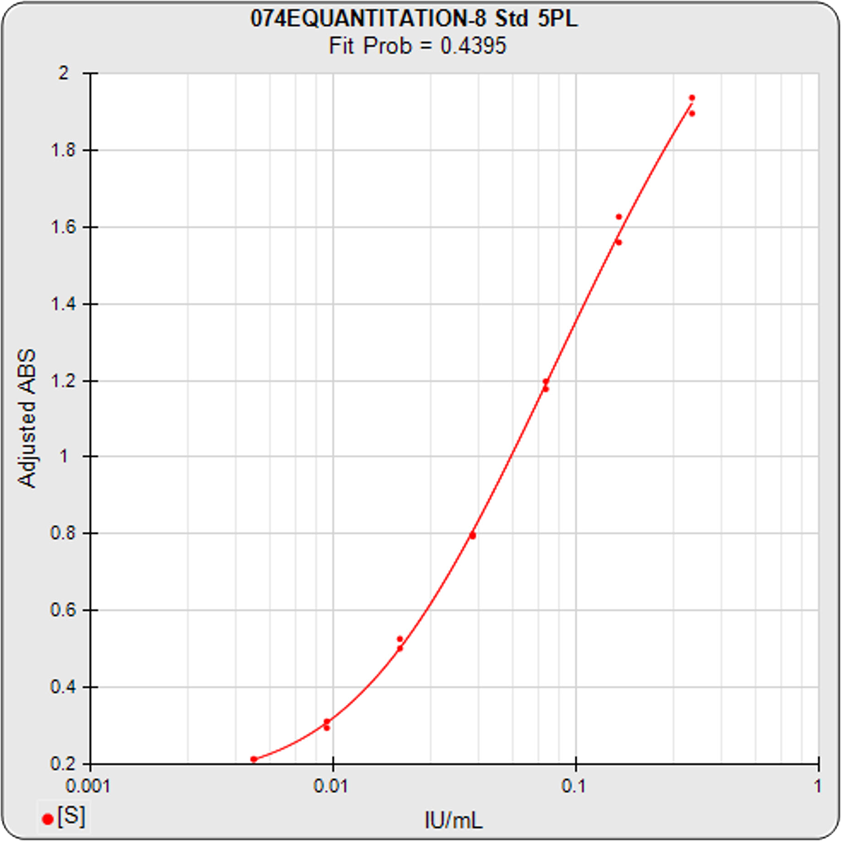
- The high resolution standard curve graph on the left depicts the relationship between responses and doses with the most accurate and robust 5PL, 4PL, and linear regression curve fitting algorithms in the industry.
- With the software’s accurate weighting (see Tech Note: Curve Weighting), the squared residual errors (red bars) between the observed responses and predicted responses off the curve should be low for each dilution, as shown in middle graph. A high residual2 indicates a bad dilution.
- The graph on the right shows the concentration errors vs. dose of the standard curve in red, with the unknown concentration errors plotted as blue dots. The LLOQ, ULOQ and the reportable range you set for this test method are plotted in green. See the Tech Note: LOQs, LODs on the software’s precision error profile method.
How Did This Assay Perform?
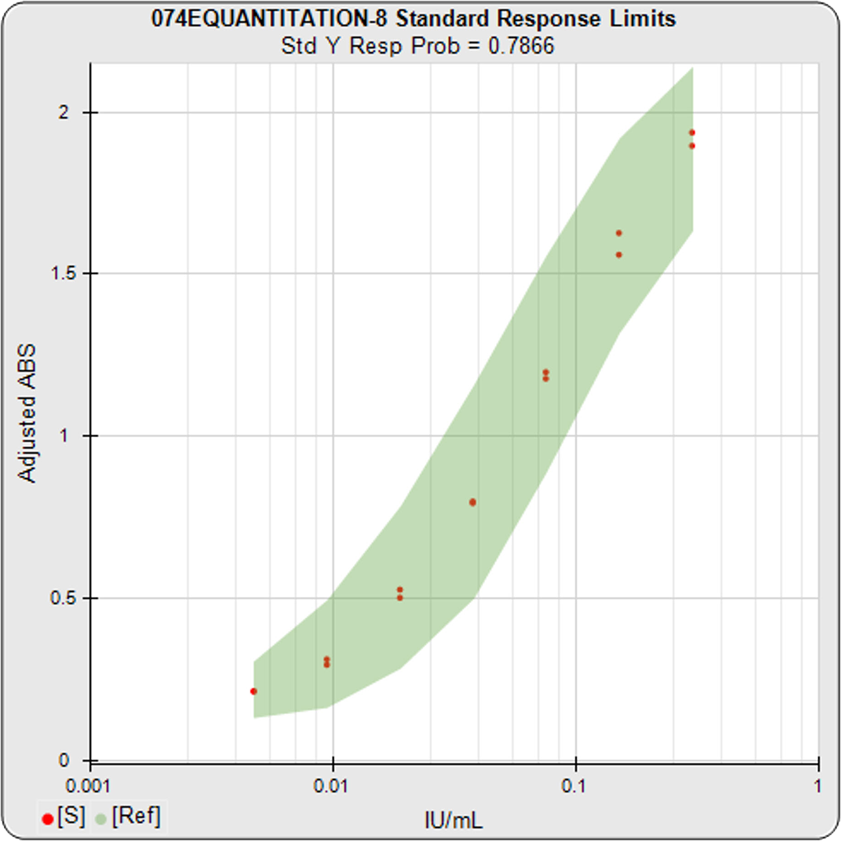
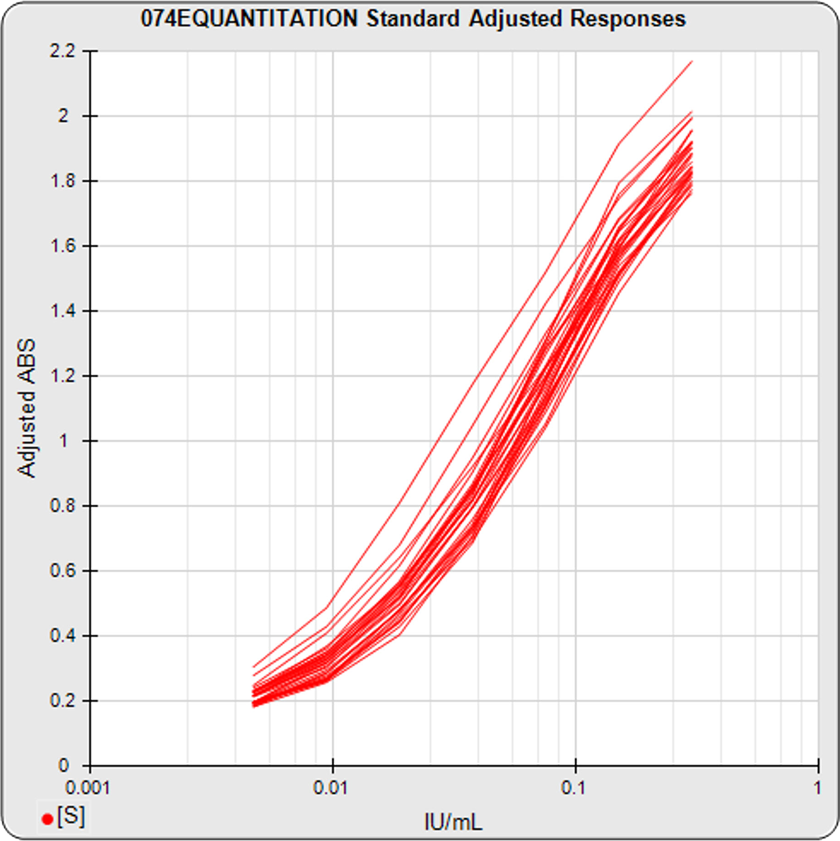
Std Responses
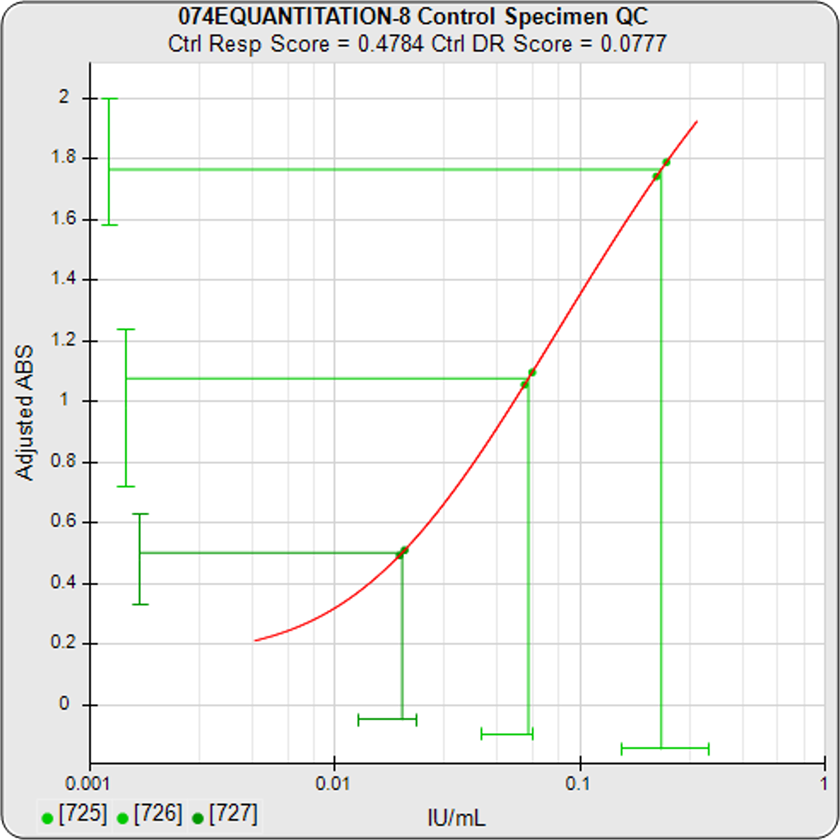
Assay Controls
How Good Is Your Assay?
- The current standard response replicates are red dots that are within or are outside the green confidence limits of the standard dilution responses determined from previous assays.
- A line from each control response and dose in the assay is plotted against their respective confidence limits. The response and dose lines are green when inside their confidence limits, or red when outside their confidence limits.
Standard Dilution Response Limits Established For Your Assays
Std Curves
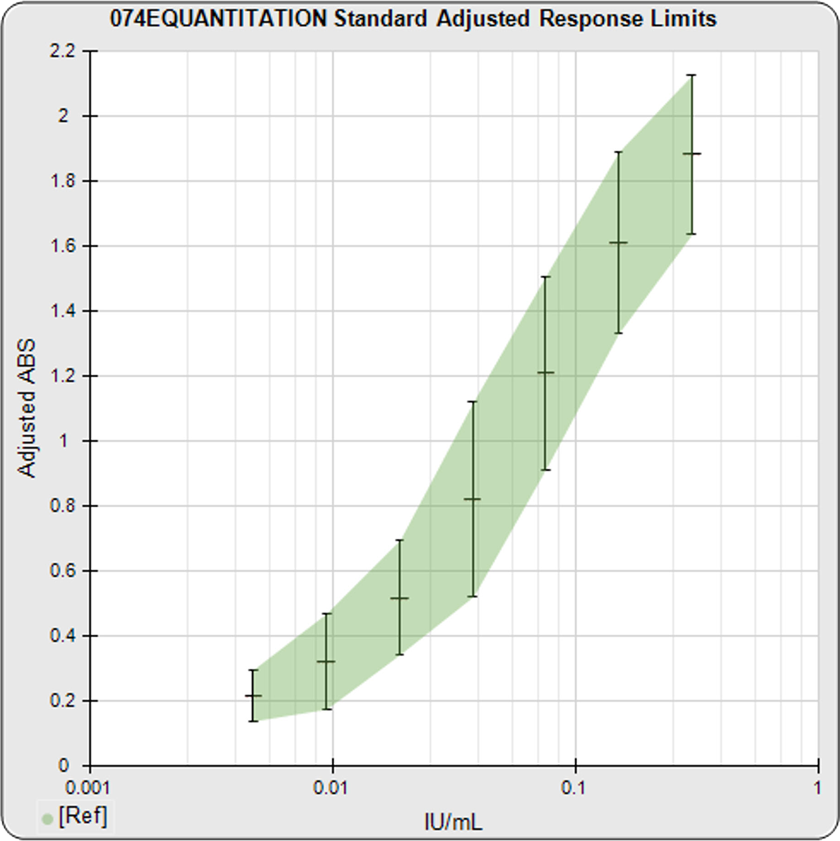
Std Limits
Std Responses
Standard Dilution Response Limits Established For Your Assays
- The graph on the left shows the responses from each of the standard dilutions in your pooled assays.
- The graph in the middle shows the confidence limits for each standard dilution using the data from your pooled assay responses, after filtering out any outliers.
- The graph on the right shows these confidence limits plotted with the standard dilution responses (red dots) of your assay. From this graph, you can see how the assay is behaving compared to the expected behavior determined by your previous assays.
- The development tools in STATLIA MATRIX can help you determine optimal dilution doses and other factors to make your quantitation test more stable and precise.
Limits Established for Control Doses and Responses
Control Limits
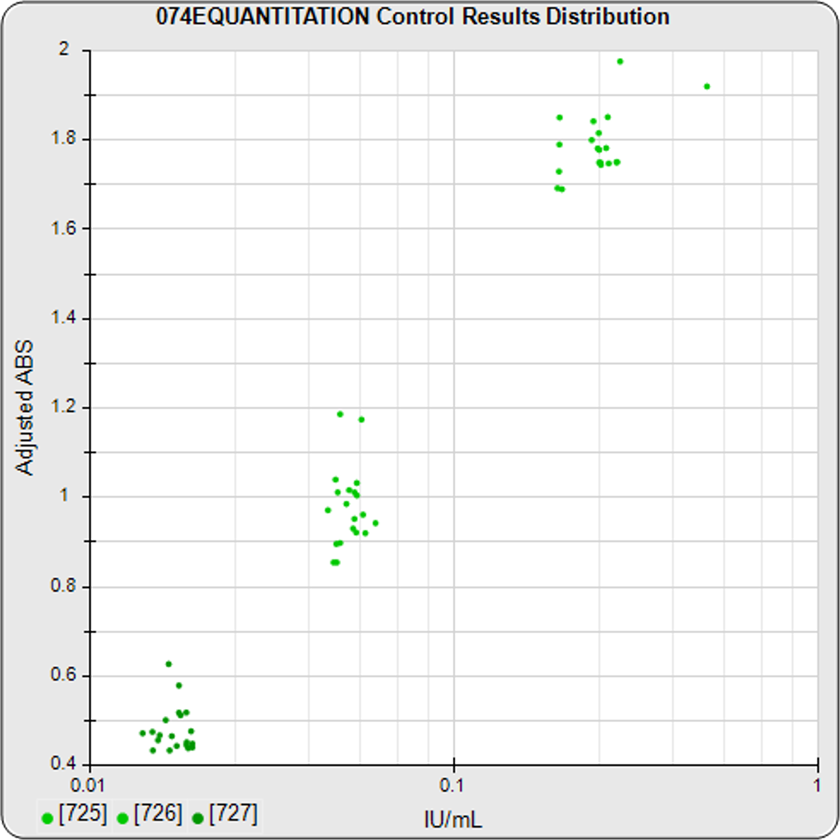
Assay Controls
Limits Established for Control Doses and Responses
- The response and computed dose of each control from your previously run assays is plotted in the graph on the left in the Performance Analysis report. Confidence limits are computed for the response and dose of each control from these data points, after filtering out any outliers.
- In the graph on the right, each control response and dose is plotted as a line against its confidence limits in an assay report. The response and dose lines are green when inside their limits, or red when outside. When the response and the dose are both outside their limits, the control itself is bad.
Establish A Reportable Range That Matches Your Unknown Population
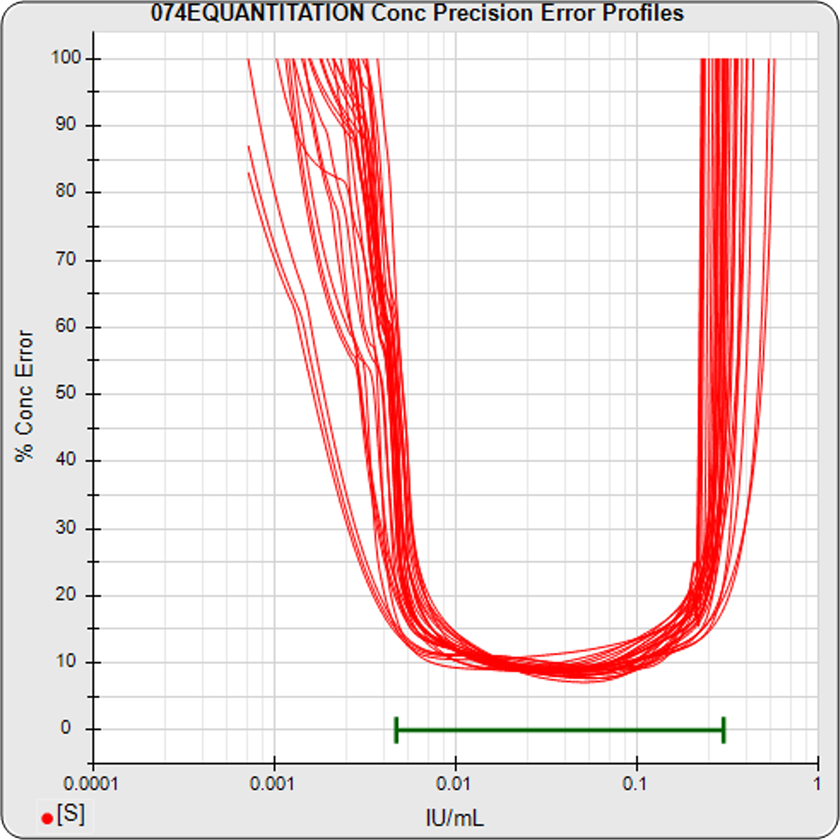
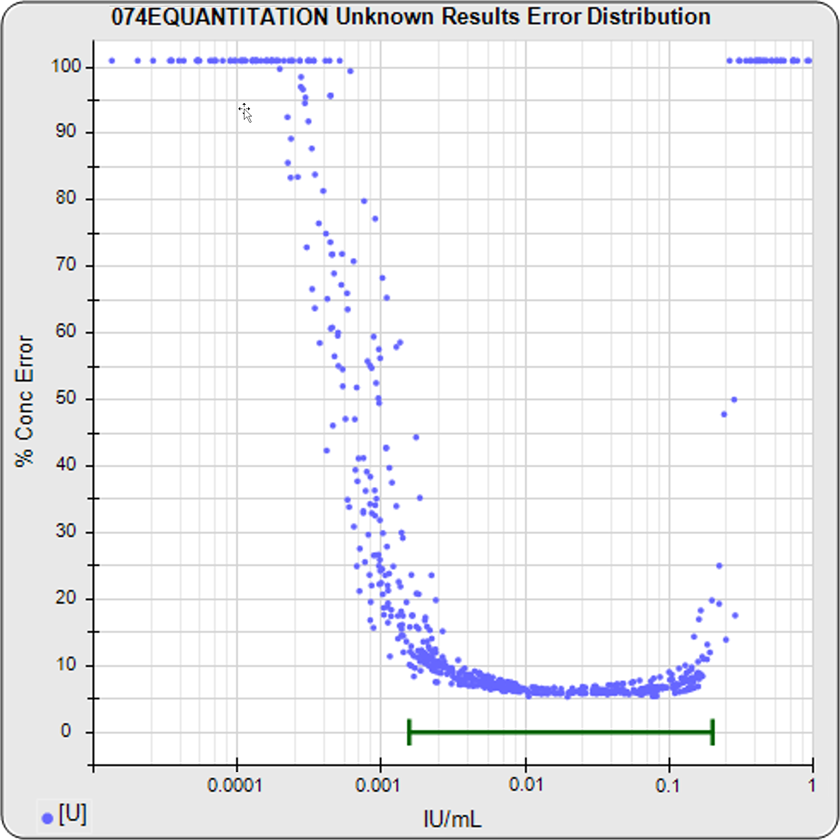
Precision Error Profiles
Uk Conc Precision Errors
Uk Ref Range
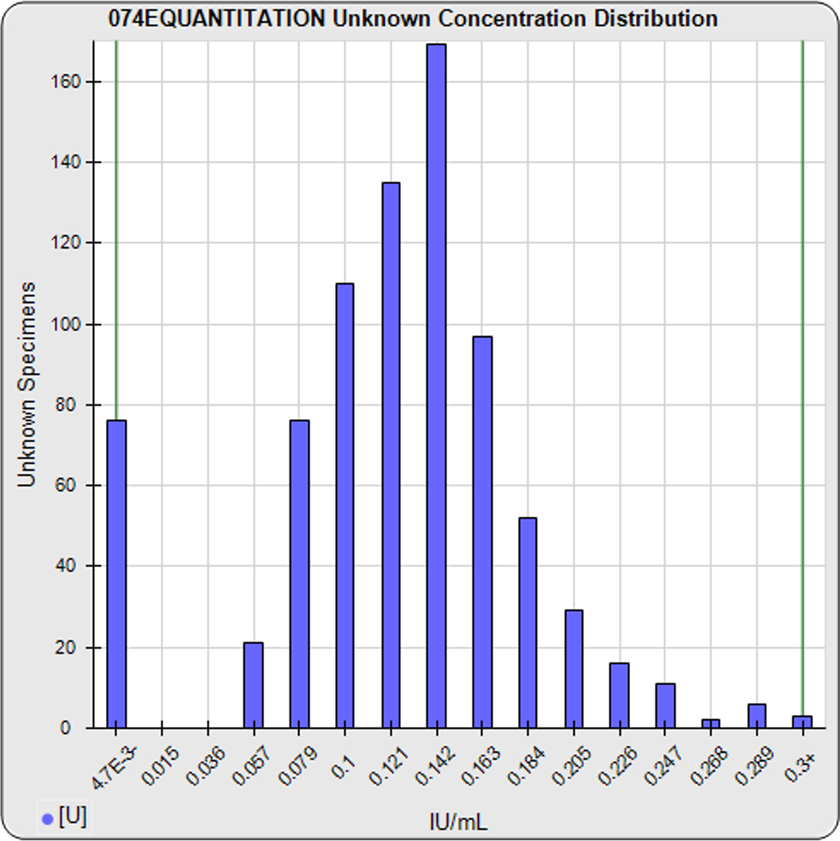
Set Reportable Range to Match Unknown Population
- The graph on the left shows the standard curve concentration precision errors from a pool of your previous assays. This graph can be used to establish a reliable reportable range (green horizontal bar) for this test. See the Tech Note: LOQs, LODs on the software’s precision error profile method, or the manuscript: The Five Parameter Logistic: A Characterization And Comparison With The Four Parameter Logistic.
- The middle graph shows a distribution of concentration precision errors from the unknowns of a pool of your previously run assays. This graph shows how well the reportable range (green horizontal bar) matches the unknown population.
- The distribution of unknown concentrations from your pooled assays shows the behavior of your test population and can be used to establish a reference range for that population.
Easily Set Up, Analyze and Manage Your Quantitation Assays
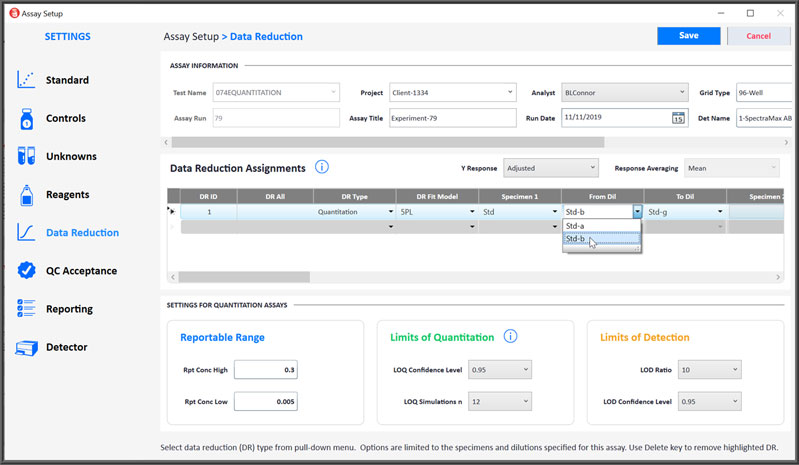
- You can select either the 5PL, 4PL or linear weighted regression curve fitting for Quantitation assays.
- End point hooks can be masked from the regression curve or line by starting and/or ending the dilution series at a different point.
- Set an optimal reportable range for your test. Results outside the range are reported as < or > the reportable range limit.
- Set an acceptable concentration error threshold for your results in QC Acceptance. The settings for the Monte Carlo concentration error estimates and limits of quantitation can be adjusted.
- You can set more than one data reduction (DR ID) for an assay, for example you can compute a 5PL and a 4PL to compare the results.